library(StanHeaders)
library(ggplot2)
library(rstan)
rstan_options(auto_write = TRUE)
# 如果CPU和内存足够,设置成与马尔科夫链一样多
options(mc.cores = max(c(floor(parallel::detectCores() / 2), 1L)))

custom_colors <- c(
  "#4285f4", # GoogleBlue
  "#34A853", # GoogleGreen
  "#FBBC05", # GoogleYellow
  "#EA4335"  # GoogleRed
)
rstan_ggtheme_options(
  panel.background = element_rect(fill = "white"),
  legend.position = "top"
)
rstan_gg_options(
  fill = "#4285f4", color = "white",
  pt_color = "#EA4335", chain_colors = custom_colors
)35 分层正态模型
介绍分层正态模型的定义、结构、估计,分层正态模型与线性生长模型的关系,分层正态模型与潜变量模型的关系,分层正态模型与神经网络模型的关系,以 rstan 包和 nlme 包实现简单分层正态模型,说明 rstan 包的一些用法,比较贝叶斯参数估计和频率参数估计的结果,给出结果的解释。
35.1 rstan 包
本节以 8schools 数据为例介绍分层正态模型及 rstan 包实现,8schools 数据最早来自 Rubin (1981) ,分层正态模型如下:
\[ \begin{aligned} y_j &\sim \mathcal{N}(\theta_j,\sigma_j^2) \quad \theta_j = \mu + \tau * \eta_j \\ \theta_j &\sim \mathcal{N}(\mu, \tau^2) \quad \eta_j \sim \mathcal{N}(0,1) \\ \mu &\sim \mathcal{N}(0, 5^2) \quad \tau \sim \mathrm{Half\_Cauchy}(0,5) \end{aligned} \]
其中,\(y_j,\sigma_j\) 是已知的观测数据,\(\theta_j\) 是模型参数, \(\eta_j\) 是服从标准正态分布的潜变量,\(\mu,\tau\) 是超参数,分别服从正态分布和半柯西分布。
35.1.1 拟合模型
用 rstan 包来拟合模型
# 编译模型
eight_schools_fit <- stan(
  model_name = "eight_schools",
  # file = "code/eight_schools.stan",
  model_code = "
  // saved as eight_schools.stan
  data {
    int<lower=0> J;         // number of schools
    real y[J];              // estimated treatment effects
    real<lower=0> sigma[J]; // standard error of effect estimates
  }
  parameters {
    real mu;                // population treatment effect
    real<lower=0> tau;      // standard deviation in treatment effects
    vector[J] eta;          // unscaled deviation from mu by school
  }
  transformed parameters {
    vector[J] theta = mu + tau * eta;        // school treatment effects
  }
  model {
    target += normal_lpdf(mu | 0, 5);
    target += cauchy_lpdf(tau | 0, 5);
    target += normal_lpdf(eta | 0, 1);       // prior log-density
    target += normal_lpdf(y | theta, sigma); // log-likelihood
  }
  ",
  data = list( # 观测数据
    J = 8,
    y = c(28, 8, -3, 7, -1, 1, 18, 12),
    sigma = c(15, 10, 16, 11, 9, 11, 10, 18)
  ),
  warmup = 1000, # 每条链预处理迭代次数
  iter = 2000,   # 每条链总迭代次数
  chains = 2,    # 马尔科夫链的数目
  cores = 2,     # 指定 CPU 核心数,可以给每条链分配一个
  verbose = FALSE, # 不显示迭代的中间过程
  refresh = 0,     # 不显示采样的进度
  seed = 20190425  # 设置随机数种子,不要使用 set.seed() 函数
)
#> Warning: There were 1 divergent transitions after warmup. See
#> https://mc-stan.org/misc/warnings.html#divergent-transitions-after-warmup
#> to find out why this is a problem and how to eliminate them.#> Warning: Examine the pairs() plot to diagnose sampling problems35.1.2 模型输出
#> Inference for Stan model: eight_schools.
#> 2 chains, each with iter=2000; warmup=1000; thin=1;
#> post-warmup draws per chain=1000, total post-warmup draws=2000.
#>
#>           mean se_mean  sd  2.5%   25%   50%   75% 97.5% n_eff Rhat
#> mu         4.5     0.1 3.3  -1.7   2.1   4.5   6.8  10.8  1982    1
#> tau        3.6     0.1 3.3   0.1   1.2   2.7   5.1  11.6  1547    1
#> eta[1]     0.3     0.0 1.0  -1.6  -0.3   0.3   0.9   2.1  2018    1
#> eta[2]     0.1     0.0 0.9  -1.8  -0.4   0.1   0.7   1.9  2288    1
#> eta[3]     0.0     0.0 1.0  -1.9  -0.7  -0.1   0.6   2.0  2047    1
#> eta[4]     0.1     0.0 0.9  -1.8  -0.6   0.1   0.7   1.9  2031    1
#> eta[5]    -0.2     0.0 0.9  -1.9  -0.8  -0.2   0.4   1.7  2013    1
#> eta[6]    -0.1     0.0 0.9  -1.9  -0.7  -0.1   0.5   1.7  2026    1
#> eta[7]     0.4     0.0 0.9  -1.5  -0.3   0.4   1.0   2.2  1711    1
#> eta[8]     0.0     0.0 1.0  -1.9  -0.6   0.1   0.7   1.9  1984    1
#> theta[1]   6.3     0.1 5.3  -2.4   3.0   5.7   8.7  19.0  1809    1
#> theta[2]   5.0     0.1 4.6  -4.5   2.1   4.9   7.7  14.4  2480    1
#> theta[3]   4.2     0.1 5.3  -7.2   1.3   4.4   7.3  13.6  1939    1
#> theta[4]   4.7     0.1 4.8  -5.0   1.8   4.7   7.7  14.3  2283    1
#> theta[5]   3.6     0.1 4.7  -7.1   0.9   3.8   6.7  12.1  2249    1
#> theta[6]   4.0     0.1 4.8  -6.4   1.3   4.2   6.9  12.8  2243    1
#> theta[7]   6.4     0.1 4.9  -1.7   3.1   6.0   9.2  17.8  1673    1
#> theta[8]   4.8     0.1 5.4  -6.2   1.9   4.8   7.8  15.5  1786    1
#> lp__     -46.8     0.1 2.4 -52.2 -48.3 -46.4 -45.1 -43.1   732    1
#>
#> Samples were drawn using NUTS(diag_e) at Wed Oct 25 15:37:01 2023.
#> For each parameter, n_eff is a crude measure of effective sample size,
#> and Rhat is the potential scale reduction factor on split chains (at
#> convergence, Rhat=1).
提取任意一个参数的结果,如查看参数 \(\tau\) 的 95% 置信区间。
#> Inference for Stan model: eight_schools.
#> 2 chains, each with iter=2000; warmup=1000; thin=1;
#> post-warmup draws per chain=1000, total post-warmup draws=2000.
#>
#>     mean se_mean   sd 2.5% 97.5% n_eff Rhat
#> tau 3.59    0.08 3.25 0.09 11.58  1547    1
#>
#> Samples were drawn using NUTS(diag_e) at Wed Oct 25 15:37:01 2023.
#> For each parameter, n_eff is a crude measure of effective sample size,
#> and Rhat is the potential scale reduction factor on split chains (at
#> convergence, Rhat=1).
从迭代抽样数据获得与 print(fit) 一样的结果。以便后续对原始采样数据做任意的进一步分析。rstan 包扩展泛型函数 summary() 以支持对 stanfit 数据对象汇总,输出各个参数分链条和合并链条的后验分布结果。
35.1.3 操作数据
合并四条马氏链的结果
返回的结果是一个列表
#> List of 5
#>  $ mu   : num [1:2000(1d)] 5.45 8.33 7.43 6.78 2.9 ...
#>   ..- attr(*, "dimnames")=List of 1
#>   .. ..$ iterations: NULL
#>  $ tau  : num [1:2000(1d)] 1.89 1.51 4.26 4.56 8.58 ...
#>   ..- attr(*, "dimnames")=List of 1
#>   .. ..$ iterations: NULL
#>  $ eta  : num [1:2000, 1:8] 0.144 0.748 0.584 -0.814 1.225 ...
#>   ..- attr(*, "dimnames")=List of 2
#>   .. ..$ iterations: NULL
#>   .. ..$           : NULL
#>  $ theta: num [1:2000, 1:8] 5.72 9.46 9.92 3.06 13.41 ...
#>   ..- attr(*, "dimnames")=List of 2
#>   .. ..$ iterations: NULL
#>   .. ..$           : NULL
#>  $ lp__ : num [1:2000(1d)] -43.4 -44.9 -44.2 -49.4 -44.6 ...
#>   ..- attr(*, "dimnames")=List of 1
#> .. ..$ iterations: NULL#> [1] "list"计算参数 \(\eta,\theta\) 的均值
#> [1]  0.31492667  0.11850228 -0.04749613  0.06844763 -0.16271317 -0.11710152
#> [7] 0.37364288 0.02956533#> [1] 6.298835 4.975833 4.182880 4.730020 3.619704 3.954601 6.441869 4.819558计算参数 \(\eta,\theta\) 的分位点
#>
#>             2.5%        25%         50%       75%    97.5%
#>   [1,] -1.649790 -0.2884808  0.34715865 0.9493778 2.124602
#>   [2,] -1.767215 -0.4343611  0.12601215 0.7182071 1.879222
#>   [3,] -1.928656 -0.6913967 -0.05904703 0.5768289 1.957554
#>   [4,] -1.810225 -0.5572786  0.07227568 0.6993142 1.890309
#>   [5,] -1.894711 -0.8035340 -0.16674610 0.4300729 1.738207
#>   [6,] -1.924375 -0.7399751 -0.09826188 0.4809399 1.696882
#>   [7,] -1.499980 -0.2613447  0.39143078 1.0136602 2.222585
#> [8,] -1.879514 -0.6438449 0.05234264 0.6971619 1.873697#>
#> 2.5% 25% 50% 75% 97.5%
#> [1,] -2.367716 3.0251099 5.746863 8.748170 18.97499
#> [2,] -4.471293 2.1442572 4.890249 7.684494 14.37772
#> [3,] -7.176916 1.3440112 4.421656 7.349481 13.57341
#> [4,] -4.971603 1.8197141 4.660261 7.659946 14.31740
#> [5,] -7.079469 0.9452173 3.843330 6.706341 12.09083
#> [6,] -6.403320 1.2903361 4.197065 6.867028 12.77380
#> [7,] -1.665954 3.0561021 6.000272 9.185255 17.80486
#> [8,] -6.181637 1.8927219 4.847361 7.753256 15.46513计算参数 \(\mu,\tau\) 的均值
#> $mu
#> [1] 4.472989#> $tau
#> [1] 3.589184#> $lp__
#> [1] -46.82812计算参数 \(\mu,\tau\) 的分位点
#> $mu
#>      2.5%       25%       50%       75%     97.5%
#> -1.707408 2.114424 4.515589 6.769141 10.752551#> $tau
#> 2.5% 25% 50% 75% 97.5%
#> 0.08738288 1.20489349 2.69546442 5.10871579 11.58292459#> $lp__
#> 2.5% 25% 50% 75% 97.5%
#> -52.20550 -48.25818 -46.43499 -45.08143 -43.0957635.1.4 采样诊断
获取马尔科夫链迭代点列数据
eight_schools_sim 是一个三维数组,1000(次迭代)* 2 (条链)* 19(个参数)。如果 permuted = TRUE 则会合并四条马氏链的迭代结果,变成一个列表。
#> [1] "array"#> num [1:1000, 1:2, 1:19] 3.69 4.11 4.35 4.22 4.22 ...
#> - attr(*, "dimnames")=List of 3
#> ..$ iterations: NULL
#> ..$ chains : chr [1:2] "chain:1" "chain:2"
#> ..$ parameters: chr [1:19] "mu" "tau" "eta[1]" "eta[2]" ...提取参数 \(\mu\) 的四条迭代点列
matplot(eight_schools_mu_sim,
        xlab = "Iteration", ylab = expression(mu),
        type = "l", lty = "solid", col = custom_colors
)
abline(h = apply(eight_schools_mu_sim, 2, mean), col = custom_colors)
legend("bottomleft",
       legend = paste0("chain:", 1:2), box.col = "white", inset = 0.01,
       lty = "solid", horiz = TRUE, col = custom_colors
)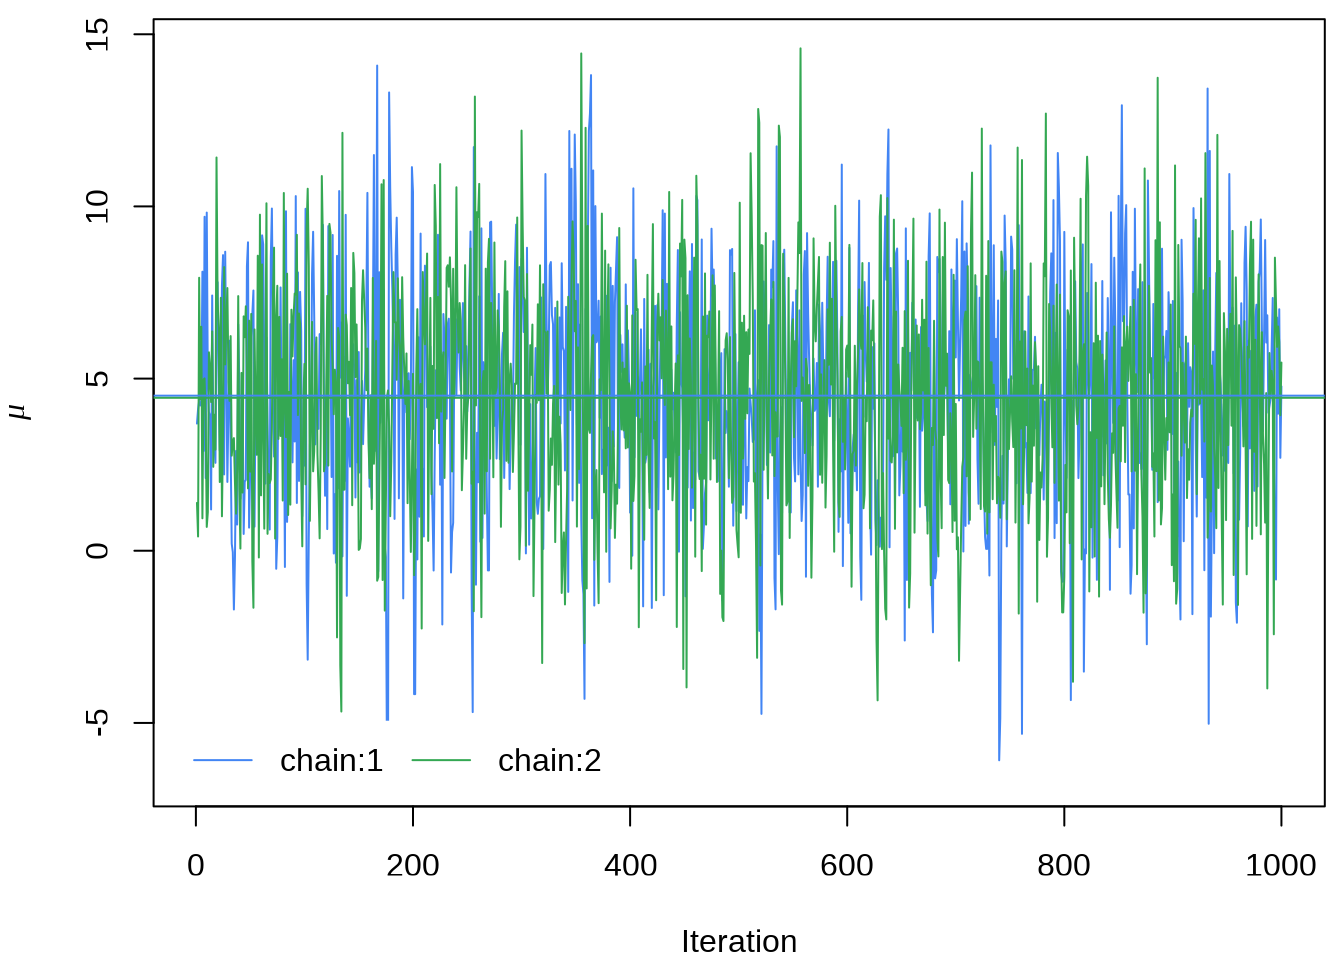
或者使用 rstan 提供的 traceplot 函数或者 stan_trace 函数,rstan 大量依赖 ggplot2 绘图,所以如果你熟悉 GGplot2 可以很方便地定制属于自己的风格,除了 rstan 提供的 rstan_ggtheme_options 和 rstan_gg_options 两个函数外,还可以使用 ggplot2 自带的大量配置选项和主题,如 theme_minimal 主题,因为 stan_trace等作图函数返回的是一个 ggplot 对象。
stan_trace(eight_schools_fit, pars = "mu") +
  theme_minimal() +
  labs(x = "Iteration", y = expression(mu))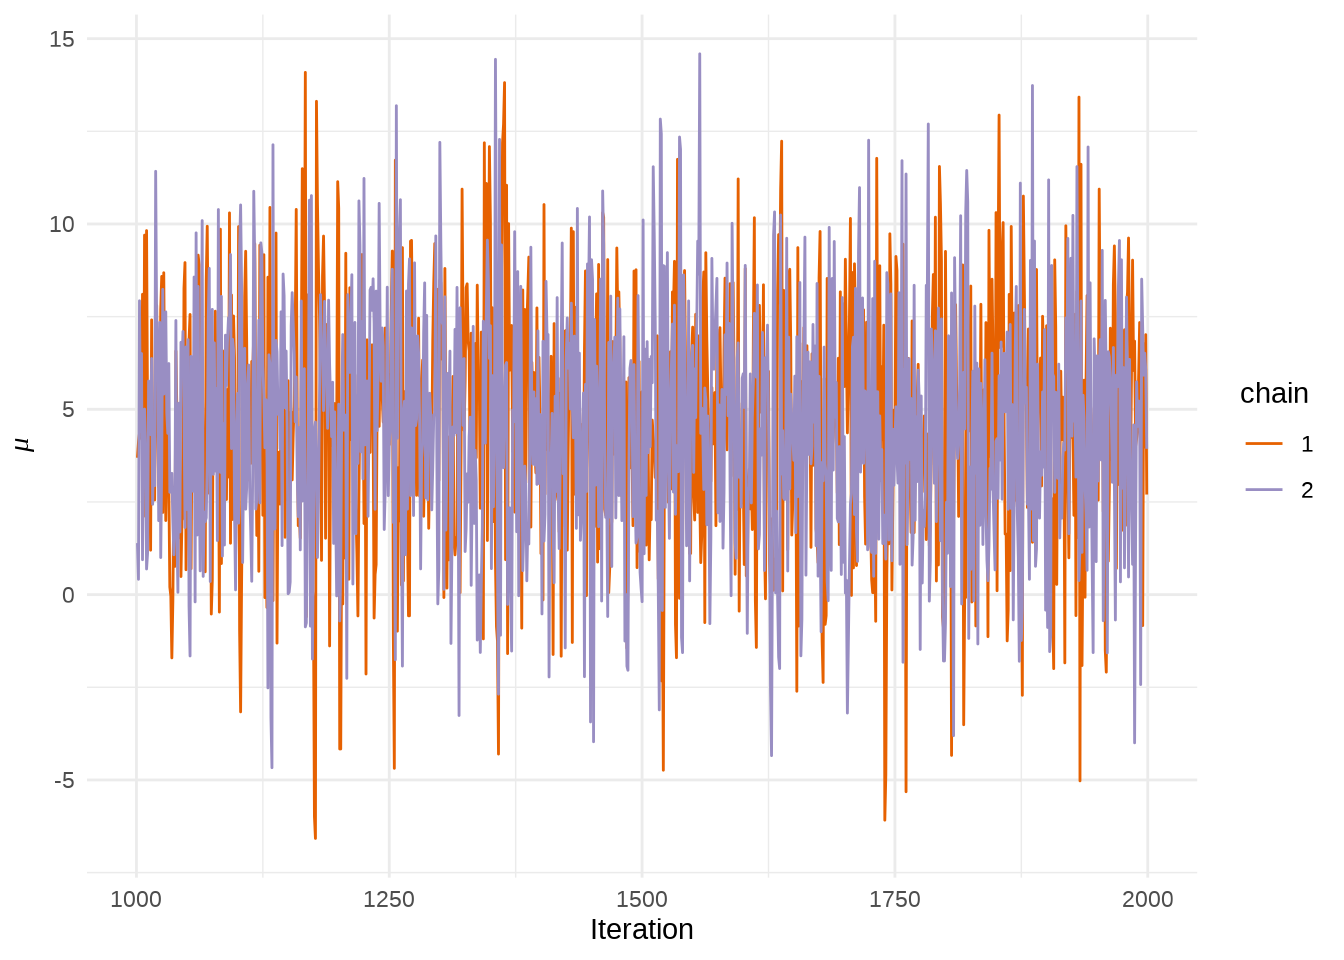
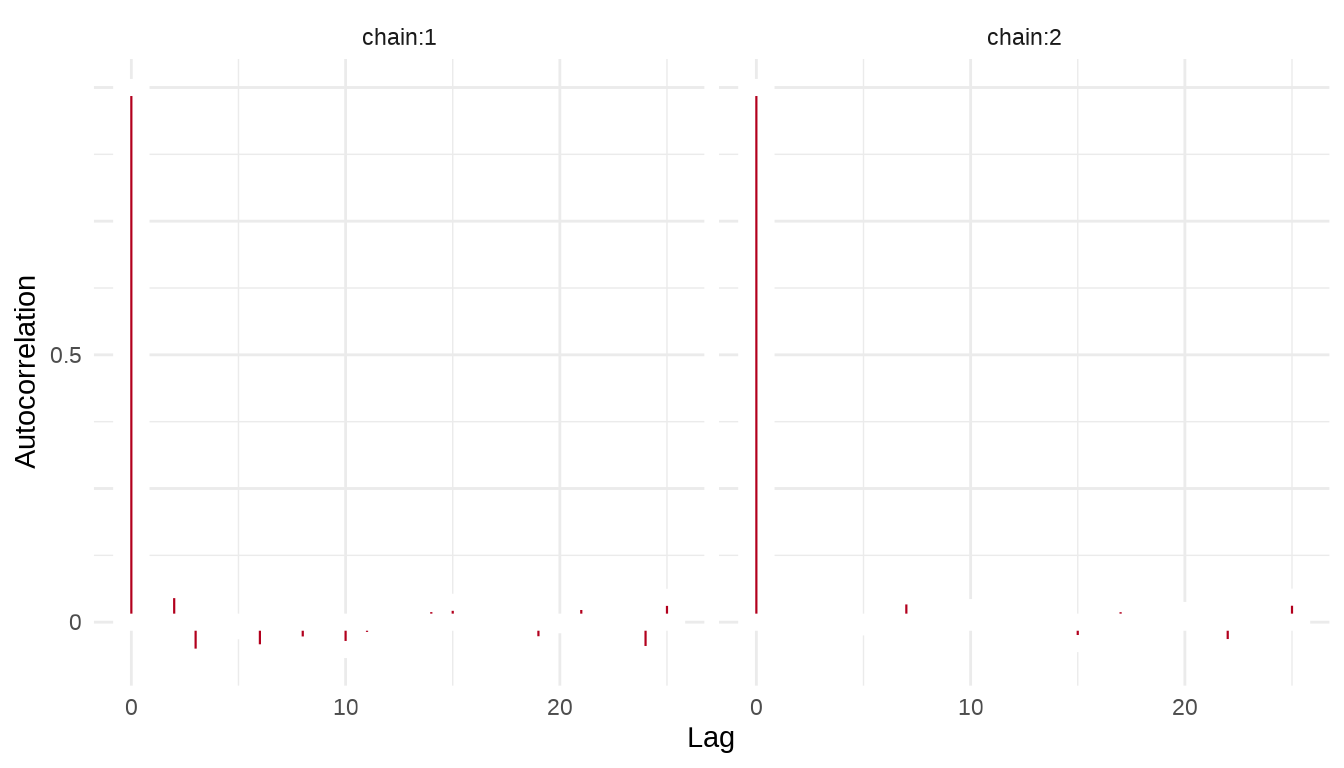
序列的自相关图,类似地,我们这里也使用 stan_ac 函数绘制自相关图
35.1.5 后验分布
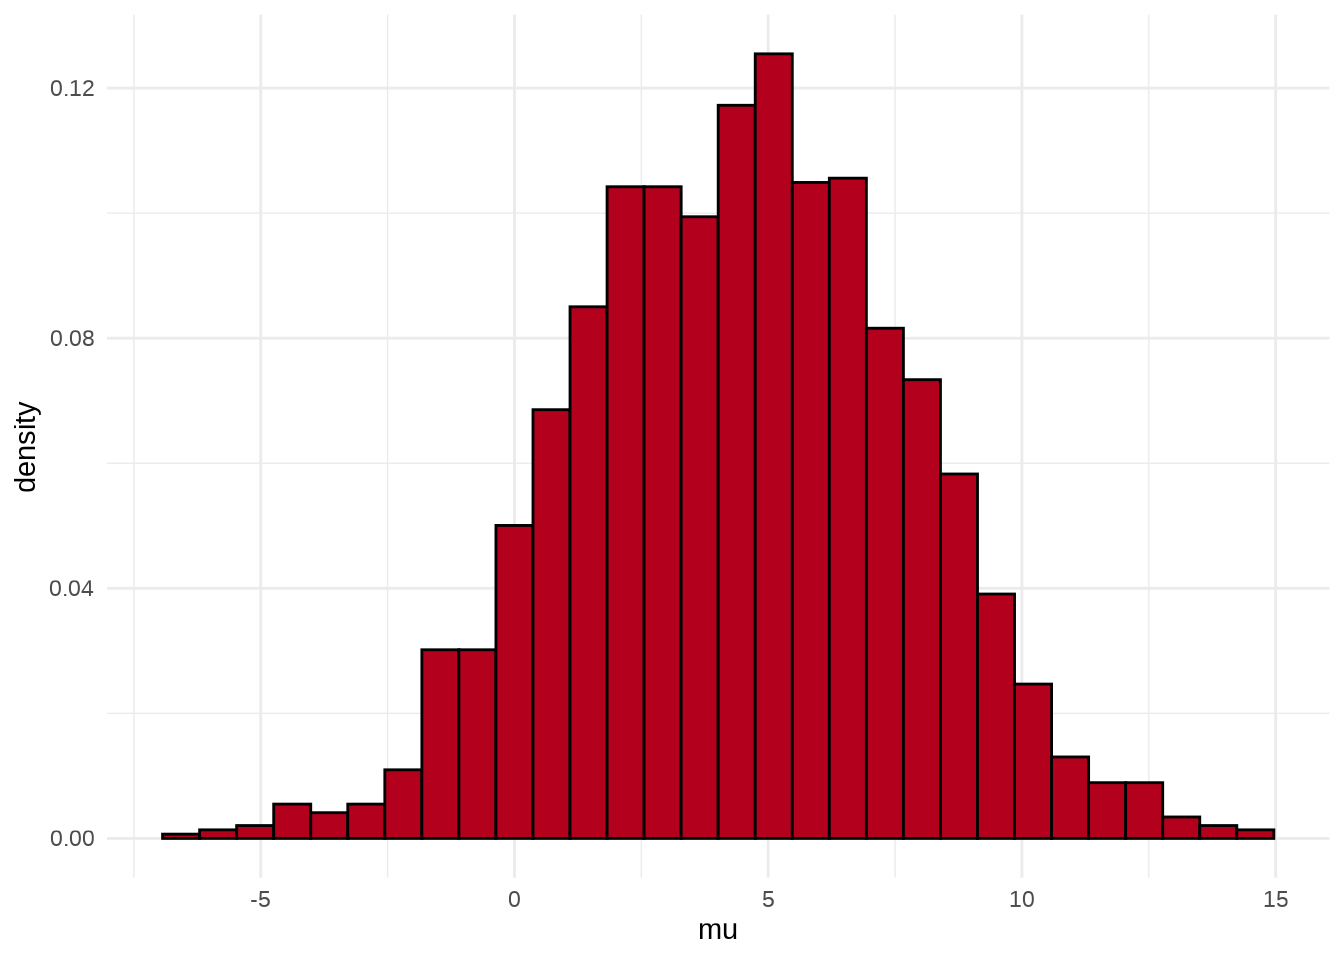
可以用 stan_hist 函数绘制参数 \(\mu\) 的后验分布图,它没有 separate_chains 参数,所以不能分链条绘制
参数 \(\mu\) 和 \(\tau\) 的散点图
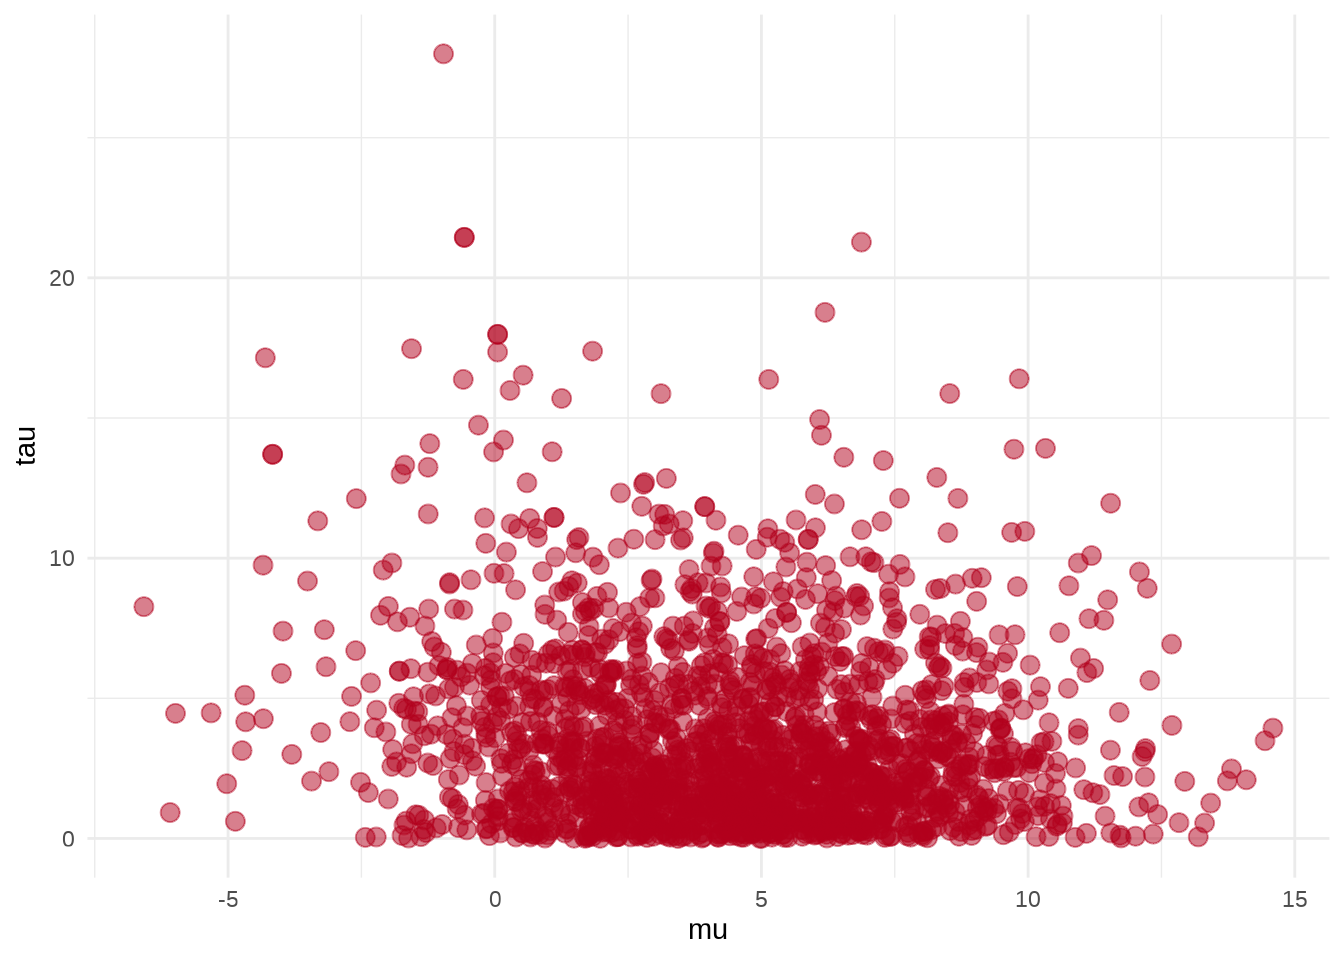
参数 \(\mu\) 的后验概率密度分布图
stan_dens(eight_schools_fit, pars = "mu", separate_chains = TRUE) +
  theme_minimal() +
  labs(x = expression(mu), y = "Density")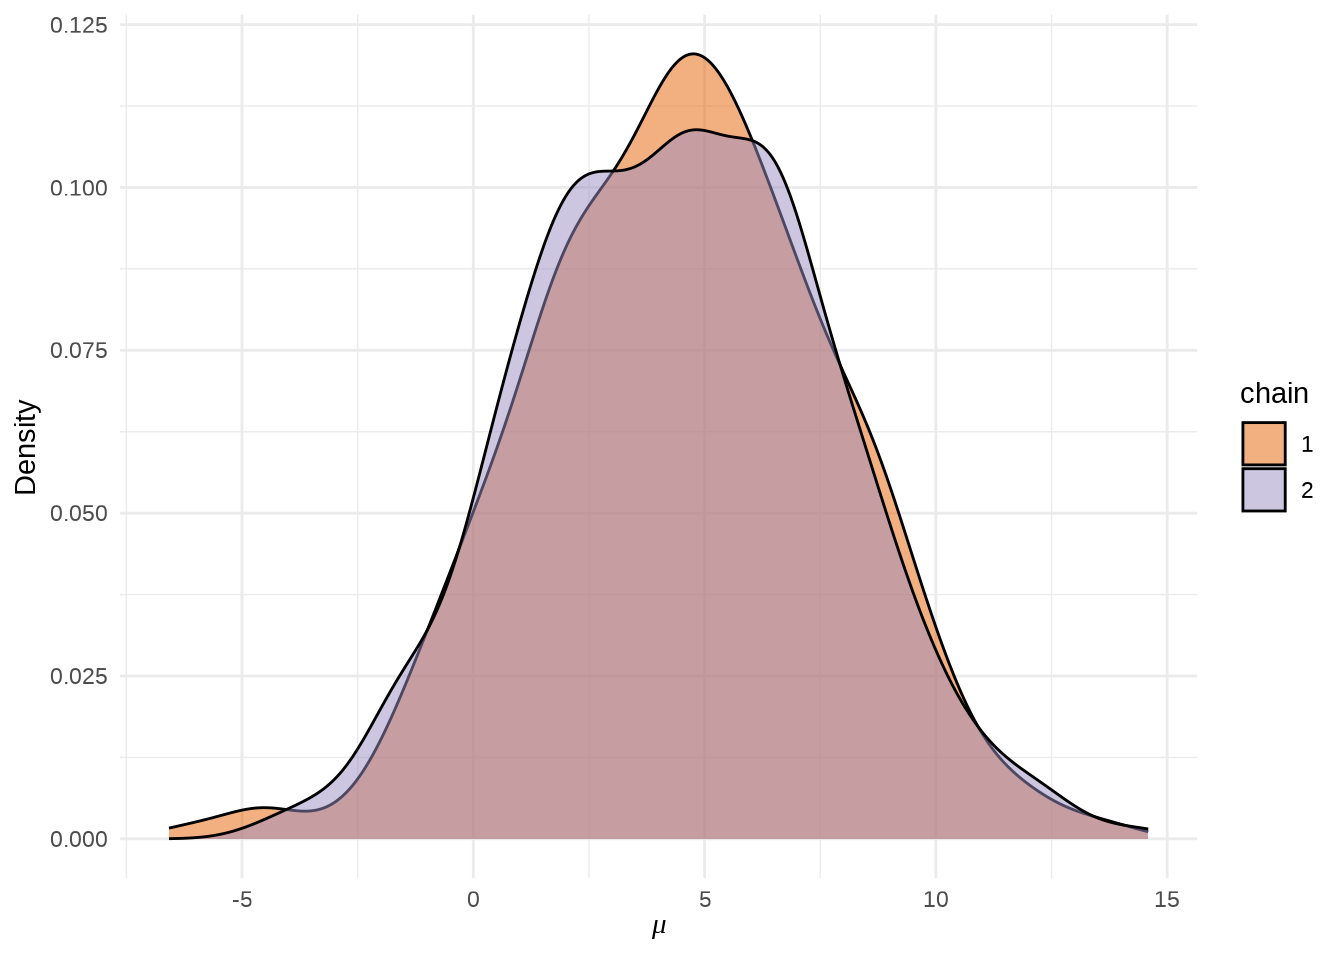
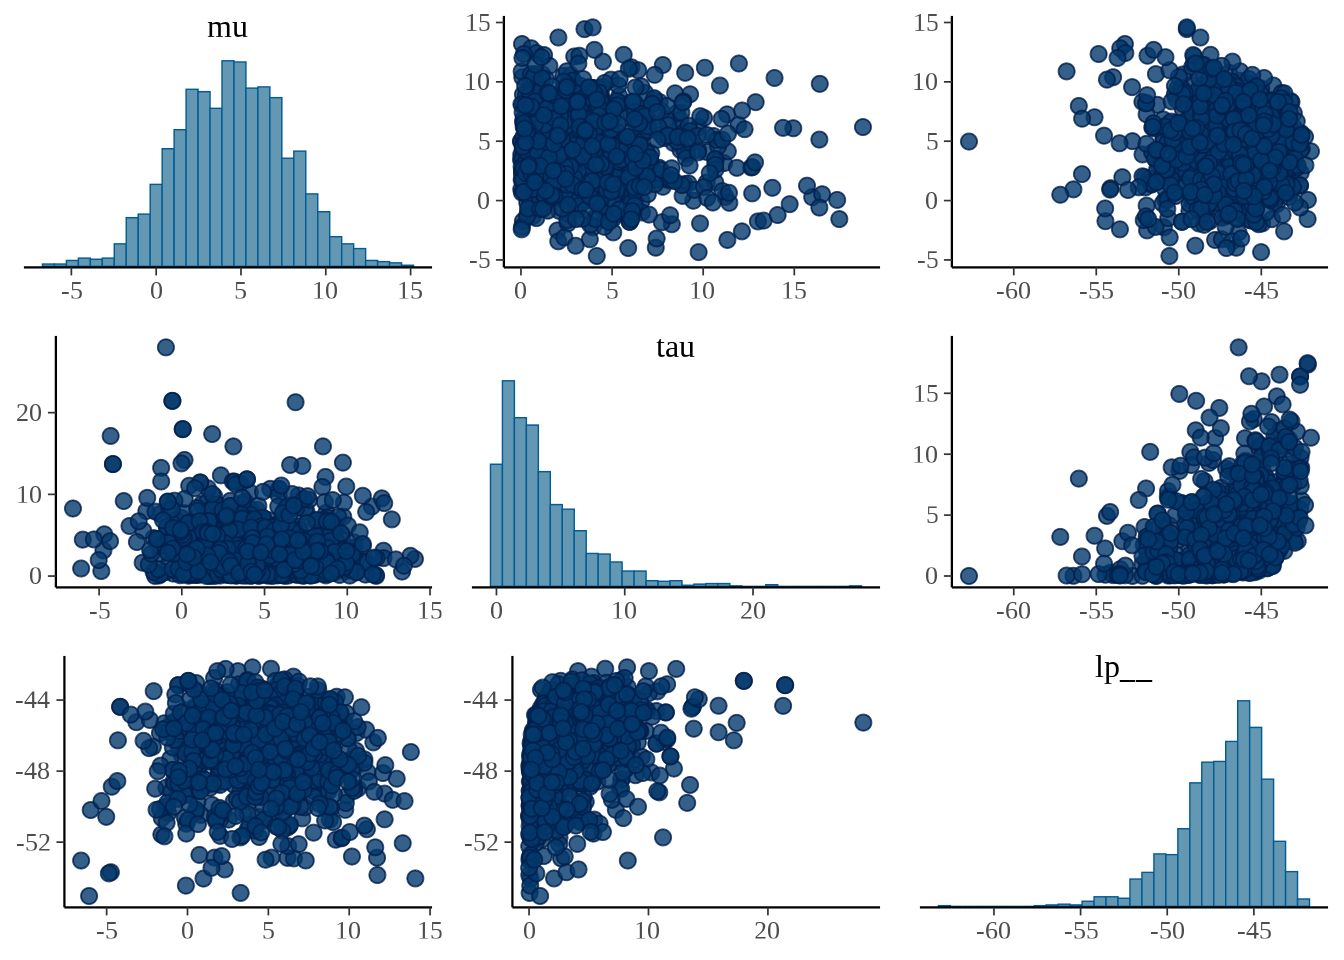
bayesplot 包的函数 mcmc_pairs() 以矩阵图展示多个参数的分布。
35.2 其它 R 包
35.2.1 nlme
接下来,用 nlme 包拟合模型。
首先,调用 nlme 包的函数 lme() 拟合模型。
library(nlme)
fit_lme <- lme(y ~ 1, random = ~ 1 | g, weights = varFixed(~ sigma^2), method = "REML")
summary(fit_lme)
#> Linear mixed-effects model fit by REML
#> Data: NULL
#> AIC BIC logLik
#> 60.21091 60.04864 -27.10546
#>
#> Random effects:
#> Formula: ~1 | g
#> (Intercept) Residual
#> StdDev: 2.917988 0.780826
#>
#> Variance function:
#> Structure: fixed weights
#> Formula: ~sigma^2
#> Fixed effects: y ~ 1
#> Value Std.Error DF t-value p-value
#> (Intercept) 7.785729 3.368082 8 2.311621 0.0496
#>
#> Standardized Within-Group Residuals:
#> Min Q1 Med Q3 Max
#> -1.06635035 -0.73588511 -0.02896764 0.50254917 1.62502386
#>
#> Number of Observations: 8
#> Number of Groups: 8随机效应的标准差 2.917988 ,随机效应部分的估计
#>   (Intercept)
#> 1  1.18135690
#> 2  0.02625714
#> 3 -0.55795544
#> 4 -0.08130333
#> 5 -1.29202241
#> 6 -0.70215328
#> 7  1.25167648
#> 8  0.17414393
类比 Stan 输出结果中的 \(\theta\) 向量,每个学校的成绩估计
35.2.2 lme4
接着,采用 lme4 包拟合模型,发现 lme4 包获得与 nlme 包一样的结果。
control <- lme4::lmerControl(
  check.conv.singular = "ignore",
  check.nobs.vs.nRE = "ignore",
  check.nobs.vs.nlev = "ignore"
)
fit_lme4 <- lme4::lmer(y ~ 1 + (1 | g), weights = 1 / sigma^2, control = control, REML = TRUE)
summary(fit_lme4)
#> Linear mixed model fit by REML ['lmerMod']
#> Formula: y ~ 1 + (1 | g)
#> Weights: 1/sigma^2
#> Control: control
#>
#> REML criterion at convergence: 54.2
#>
#> Scaled residuals:
#> Min 1Q Median 3Q Max
#> -1.06635 -0.73589 -0.02897 0.50255 1.62502
#>
#> Random effects:
#> Groups Name Variance Std.Dev.
#> g (Intercept) 8.5145 2.9180
#> Residual 0.6097 0.7808
#> Number of obs: 8, groups: g, 8
#>
#> Fixed effects:
#> Estimate Std. Error t value
#> (Intercept) 7.786 3.368 2.31235.2.3 blme
下面使用 blme 包 (Chung 等 2013) ,blme 包基于 lme4 包,截距项结果比较一致,随机效应(组间方差)和残差项(组内方差)完全不同。
# the mode should be at the boundary of the space.

fit_blme <- blme::blmer(
  y ~ 1 + (1 | g), control = control, REML = TRUE,
  cov.prior = NULL, weights = 1 / sigma^2
)
summary(fit_blme)
#> Prior dev : 0
#>
#> Linear mixed model fit by REML ['blmerMod']
#> Formula: y ~ 1 + (1 | g)
#> Weights: 1/sigma^2
#> Control: control
#>
#> REML criterion at convergence: 54.2
#>
#> Scaled residuals:
#> Min 1Q Median 3Q Max
#> -1.06635 -0.73589 -0.02897 0.50255 1.62502
#>
#> Random effects:
#> Groups Name Variance Std.Dev.
#> g (Intercept) 8.5145 2.9180
#> Residual 0.6097 0.7808
#> Number of obs: 8, groups: g, 8
#>
#> Fixed effects:
#> Estimate Std. Error t value
#> (Intercept) 7.786 3.368 2.31235.2.4 MCMCglmm
MCMCglmm 包 (Hadfield 2010) 采用 MCMC 算法拟合数据。
library(MCMCglmm)
schools <- data.frame(y = y, sigma = sigma, g = g)
schools$g <- as.factor(schools$g)
# # inverse-gamma prior with scale and shape equal to 0.001
prior1 <- list(
  R = list(V = diag(schools$sigma^2), fix = 1),
  G = list(G1 = list(V = 1, nu = 0.002))
)
# 拟合模型
fit_mcmc <- MCMCglmm(
  y ~ 1, random = ~g, rcov = ~ idh(g):units,
  data = schools, prior = prior1, verbose = FALSE
)
# 输出结果
summary(fit_mcmc)
Iterations = 3001:12991
Thinning interval = 10
Sample size = 1000
DIC: -98.08778
G-structure: ~g
post.mean l-95% CI u-95% CI eff.samp
g 12.45 0.0003472 72.02 335.7
R-structure: ~idh(g):units
post.mean l-95% CI u-95% CI eff.samp
g1.units 225 225 225 0
g2.units 100 100 100 0
g3.units 256 256 256 0
g4.units 121 121 121 0
g5.units 81 81 81 0
g6.units 121 121 121 0
g7.units 100 100 100 0
g8.units 324 324 324 0
Location effects: y ~ 1
post.mean l-95% CI u-95% CI eff.samp pMCMC
(Intercept) 7.7553 -0.8534 15.6176 1000 0.06 .
---
Signif. codes: 0 ‘***’ 0.001 ‘**’ 0.01 ‘*’ 0.05 ‘.’ 0.1 ‘ ’ 1R-structure 表示残差方差,这是已知的参数。G-structure 表示随机截距的方差,Location effects 表示固定效应的截距。
35.2.5 cmdstanr
一般地,rstan 包使用的 stan 框架版本低于 cmdstanr 包,从 rstan 包切换到 cmdstanr 包,需要注意语法、函数的变化,在都是较新的版本时,Stan 代码不需要做改动,如下:
data {
  int<lower=0> J; // 学校数目
  array[J] real y; // 测试效果的预测值
  array[J] real <lower=0> sigma; // 测试效果的标准差
}
parameters {
  real mu;
  real<lower=0> tau;
  vector[J] eta;
}
transformed parameters {
  vector[J] theta;
  theta = mu + tau * eta;
}
model {
  target += normal_lpdf(mu | 0, 5);
  target += cauchy_lpdf(tau | 0, 5);
  target += std_normal_lpdf(eta);
  target += normal_lpdf(y | theta, sigma);
}
eight_schools_dat <- list(
J = 8,
y = c(28, 8, -3, 7, -1, 1, 18, 12),
sigma = c(15, 10, 16, 11, 9, 11, 10, 18)
)
library(cmdstanr)
mod_eight_schools <- cmdstan_model(
stan_file = "code/eight_schools.stan",
compile = TRUE, cpp_options = list(stan_threads = TRUE)
)
fit_eight_schools <- mod_eight_schools$sample(
data = eight_schools_dat, # 数据
chains = 2, # 总链条数
parallel_chains = 2, # 并行数目
iter_warmup = 1000, # 每条链预处理的迭代次数
iter_sampling = 1000, # 每条链采样的迭代次数
threads_per_chain = 2, # 每条链设置 2 个线程
seed = 20232023, # 随机数种子
show_messages = FALSE, # 不显示消息
adapt_delta = 0.9, # 接受率
refresh = 0 # 不显示采样迭代的进度
)模型输出
#> # A tibble: 19 × 10
#>    variable     mean   median    sd   mad      q5    q95  rhat ess_bulk ess_tail
#>    <chr>       <num>    <num> <num> <num>   <num>  <num> <num>    <num>    <num>
#>  1 lp__     -46.8    -46.5    2.33  2.16  -51.1   -43.7   1.00     924.    1244.
#>  2 mu         4.36     4.39   3.16  3.36   -0.857   9.55  1.00    1951.    1585.
#>  3 tau        3.57     2.61   3.27  2.61    0.218  10.3   1.00    1550.    1157.
#>  4 eta[1]     0.324    0.296  1.03  1.04   -1.38    2.01  1.00    2169.    1345.
#>  5 eta[2]     0.0927   0.109  0.941 0.940  -1.52    1.62  1.00    2749.    1510.
#>  6 eta[3]    -0.0972  -0.0879 0.943 0.941  -1.66    1.38  1.00    2468.    1285.
#>  7 eta[4]     0.0806   0.0822 0.937 0.881  -1.49    1.64  1.00    2081.    1340.
#>  8 eta[5]    -0.171   -0.184  0.901 0.919  -1.65    1.30  1.00    2346.    1333.
#>  9 eta[6]    -0.0781  -0.0745 0.926 0.884  -1.58    1.47  1.00    2089.    1507.
#> 10 eta[7]     0.361    0.372  0.953 0.936  -1.21    1.89  1.00    2300.    1681.
#> 11 eta[8]     0.0834   0.0983 0.968 0.950  -1.51    1.67  1.00    2577.    1587.
#> 12 theta[1]   6.31     5.50   5.89  4.47   -1.43   17.6   1.00    2203.    1724.
#> 13 theta[2]   4.91     4.76   4.64  4.02   -2.35   12.8   1.00    3215.    1781.
#> 14 theta[3]   3.77     4.03   5.17  4.56   -4.82   11.4   1.00    2044.    1606.
#> 15 theta[4]   4.71     4.61   4.74  4.19   -2.52   12.3   1.00    2183.    1526.
#> 16 theta[5]   3.46     3.78   4.59  4.03   -4.34   10.3   1.00    1984.    1677.
#> 17 theta[6]   3.94     4.11   4.75  4.20   -3.98   11.2   1.00    2157.    1510.
#> 18 theta[7]   6.29     5.77   5.15  4.32   -0.957  15.8   1.00    2011.    1508.
#> 19 theta[8]   4.81     4.76   5.16  4.23   -3.04   13.1   1.00    2060.    1581.
诊断输出
35.3 案例:rats 数据
rats 数据最早来自 Gelfand 等 (1990) ,记录 30 只小鼠每隔一周的重量,一共进行了 5 周。第一次记录是小鼠第 8 天的时候,第二次测量记录是第 15 天的时候,一直持续到第 36 天。下面在 R 环境中准备数据。
# 总共 30 只老鼠
N <- 30
# 总共进行 5 周
T <- 5
# 小鼠重量
y <- structure(c(
  151, 145, 147, 155, 135, 159, 141, 159, 177, 134,
  160, 143, 154, 171, 163, 160, 142, 156, 157, 152, 154, 139, 146,
  157, 132, 160, 169, 157, 137, 153, 199, 199, 214, 200, 188, 210,
  189, 201, 236, 182, 208, 188, 200, 221, 216, 207, 187, 203, 212,
  203, 205, 190, 191, 211, 185, 207, 216, 205, 180, 200, 246, 249,
  263, 237, 230, 252, 231, 248, 285, 220, 261, 220, 244, 270, 242,
  248, 234, 243, 259, 246, 253, 225, 229, 250, 237, 257, 261, 248,
  219, 244, 283, 293, 312, 272, 280, 298, 275, 297, 350, 260, 313,
  273, 289, 326, 281, 288, 280, 283, 307, 286, 298, 267, 272, 285,
  286, 303, 295, 289, 258, 286, 320, 354, 328, 297, 323, 331, 305,
  338, 376, 296, 352, 314, 325, 358, 312, 324, 316, 317, 336, 321,
  334, 302, 302, 323, 331, 345, 333, 316, 291, 324
), .Dim = c(30, 5))
# 第几天
x <- c(8.0, 15.0, 22.0, 29.0, 36.0)
xbar <- 22.0
重复测量的小鼠重量数据 rats 如下 表格 35.1 所示。
| 第 8 天 | 第 15 天 | 第 22 天 | 第 29 天 | 第 36 天 | |
|---|---|---|---|---|---|
| 1 | 151 | 199 | 246 | 283 | 320 |
| 2 | 145 | 199 | 249 | 293 | 354 |
| 3 | 147 | 214 | 263 | 312 | 328 |
| 4 | 155 | 200 | 237 | 272 | 297 |
| 5 | 135 | 188 | 230 | 280 | 323 |
| 6 | 159 | 210 | 252 | 298 | 331 |
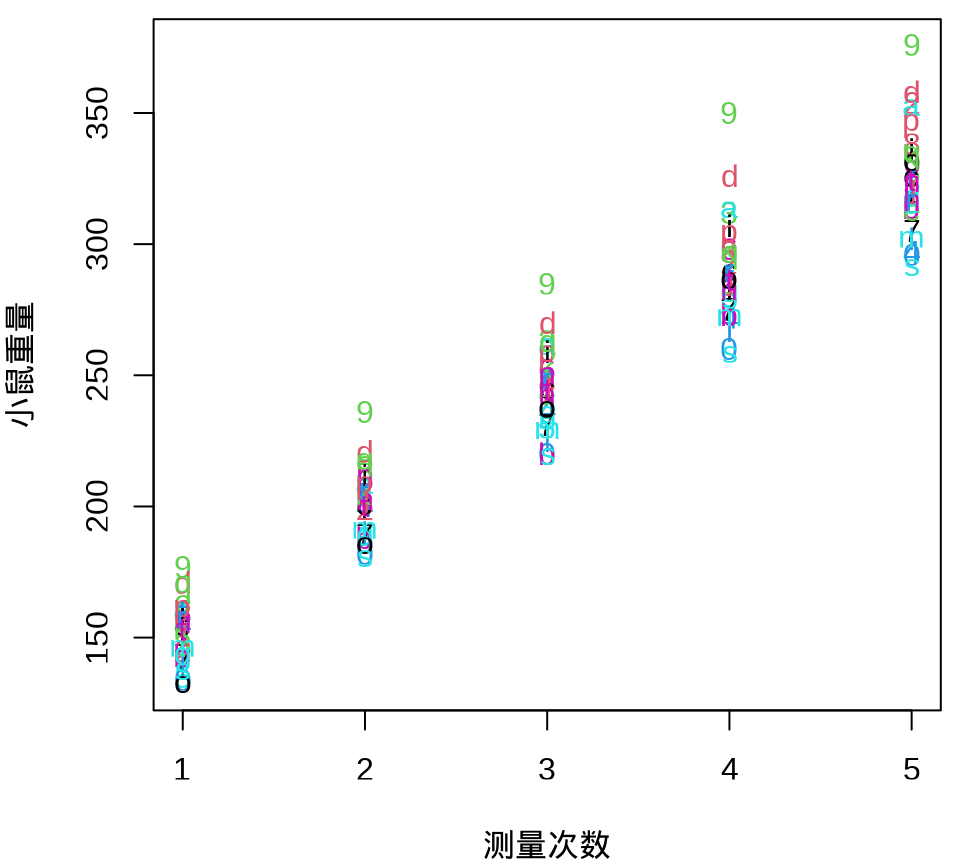
小鼠重量数据的分布情况见下 图 35.8 ,由图可以假定 30 只小鼠的重量服从正态分布。
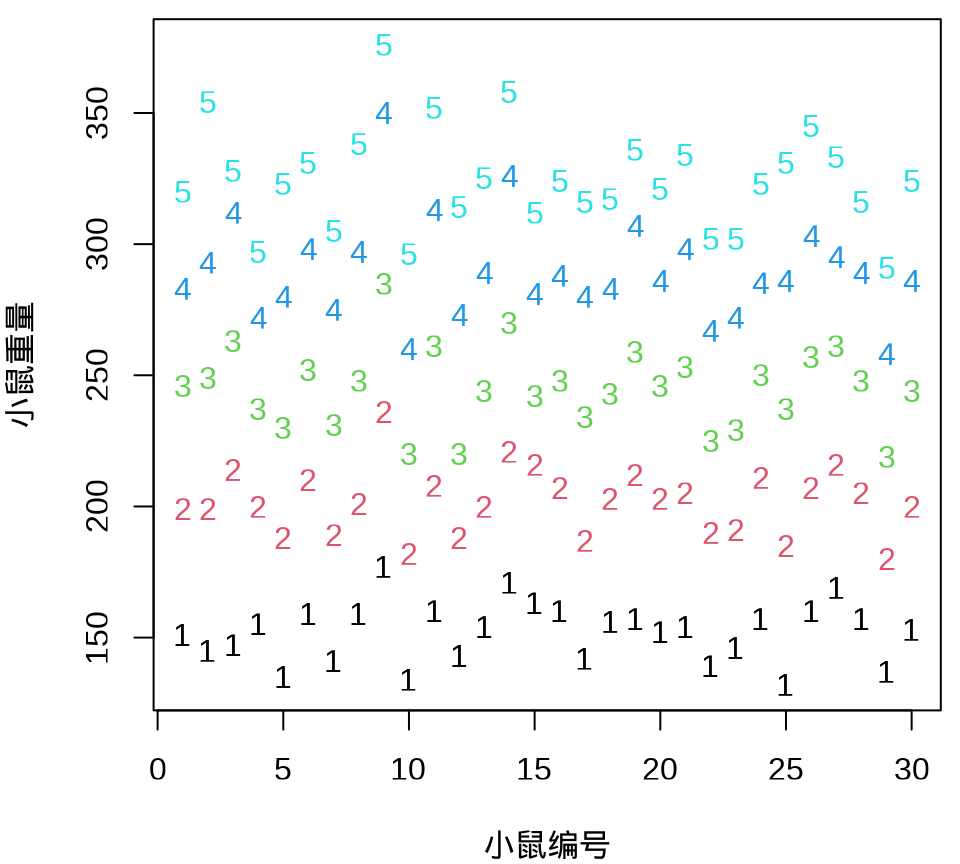
由 图 35.9 可见, 30 只小鼠的重量增长趋势呈现一种线性趋势。
35.4 频率学派
35.4.1 nlme
nlme 包适合长格式的数据,因此,先将小鼠数据整理成长格式。
weight <- c(
  151, 145, 147, 155, 135, 159, 141, 159, 177, 134,
  160, 143, 154, 171, 163, 160, 142, 156, 157, 152, 154, 139, 146,
  157, 132, 160, 169, 157, 137, 153, 199, 199, 214, 200, 188, 210,
  189, 201, 236, 182, 208, 188, 200, 221, 216, 207, 187, 203, 212,
  203, 205, 190, 191, 211, 185, 207, 216, 205, 180, 200, 246, 249,
  263, 237, 230, 252, 231, 248, 285, 220, 261, 220, 244, 270, 242,
  248, 234, 243, 259, 246, 253, 225, 229, 250, 237, 257, 261, 248,
  219, 244, 283, 293, 312, 272, 280, 298, 275, 297, 350, 260, 313,
  273, 289, 326, 281, 288, 280, 283, 307, 286, 298, 267, 272, 285,
  286, 303, 295, 289, 258, 286, 320, 354, 328, 297, 323, 331, 305,
  338, 376, 296, 352, 314, 325, 358, 312, 324, 316, 317, 336, 321,
  334, 302, 302, 323, 331, 345, 333, 316, 291, 324
)
rats <- rep(1:30, times = 5)
days <- rep(c(8, 15, 22, 29, 36), each = 30)
rats_data <- data.frame(weight = weight, rats = rats, days = days)
将 30 只小鼠的重量变化及回归曲线画出来,发现各只小鼠的回归线的斜率几乎一样,截距略有不同。不同小鼠的出生重量是不同,前面 Stan 采用变截距变斜率的混合效应模型拟合数据。
ggplot(data = rats_data, aes(x = days, y = weight)) +
  geom_point() +
  geom_smooth(formula = "y ~ x", method = "lm", se = FALSE) +
  theme_bw() +
  facet_wrap(facets = ~rats, labeller = "label_both", ncol = 6) +
  labs(x = "第几天", y = "重量")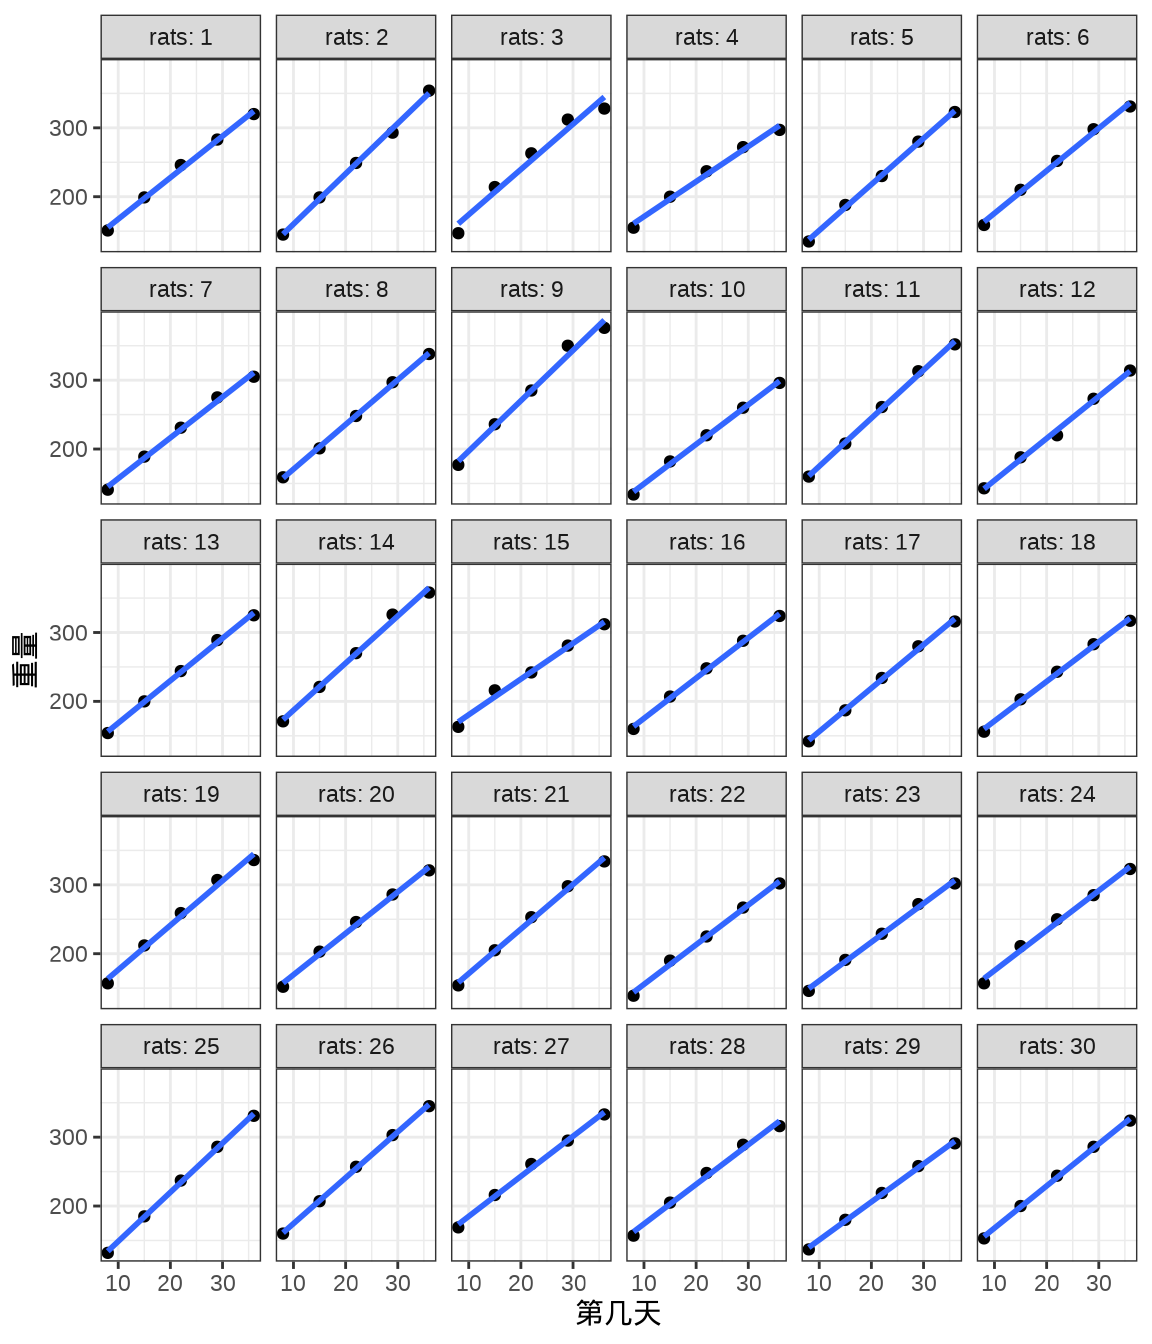
小鼠的重量随时间增长,不同小鼠的情况又会有所不同。作为一个参照,首先考虑变截距的随机效应模型。
\[ y_{ij} = \beta_0 + \beta_1 * x_j + \alpha_i + \epsilon_{ij}, \quad i = 1,2,\ldots,30. \quad j = 1,2,3,4,5 \]
其中,\(y_{ij}\) 表示第 \(i\) 只小鼠在第 \(j\) 次测量的重量,一共 30 只小鼠,共测量了 5 次。固定效应部分是 \(\beta_0\) 和 \(\beta_1\) ,分别表示截距和斜率。随机效应部分是 \(\alpha_i\) 和 \(\epsilon_{ij}\) ,分别服从正态分布\(\alpha_i \sim \mathcal{N}(0, \sigma^2_{\alpha})\) 和 \(\epsilon_{ij} \sim \mathcal{N}(0, \sigma^2_{\epsilon})\) 。\(\sigma^2_{\alpha}\) 和 \(\sigma^2_{\epsilon}\) 分别表示组间方差(group level)和组内方差(individual level)。
library(nlme)
rats_lme0 <- lme(data = rats_data, fixed = weight ~ days, random = ~ 1 | rats)
summary(rats_lme0)
#> Linear mixed-effects model fit by REML
#> Data: rats_data
#> AIC BIC logLik
#> 1145.302 1157.29 -568.6508
#>
#> Random effects:
#> Formula: ~1 | rats
#> (Intercept) Residual
#> StdDev: 14.03351 8.203811
#>
#> Fixed effects: weight ~ days
#> Value Std.Error DF t-value p-value
#> (Intercept) 106.56762 3.0379720 119 35.07854 0
#> days 6.18571 0.0676639 119 91.41824 0
#> Correlation:
#> (Intr)
#> days -0.49
#>
#> Standardized Within-Group Residuals:
#> Min Q1 Med Q3 Max
#> -2.7388198 -0.4770046 0.1261342 0.5634904 2.9981636
#>
#> Number of Observations: 150
#> Number of Groups: 30当然,若考虑不同小鼠的生长速度不同(变化不是很大),可用变截距和变斜率的随机效应模型表示生长曲线模型,下面加载 nlme 包调用函数 lme() 拟合该模型。
library(nlme)
rats_lme <- lme(data = rats_data, fixed = weight ~ days, random = ~ days | rats)
summary(rats_lme)
#> Linear mixed-effects model fit by REML
#> Data: rats_data
#> AIC BIC logLik
#> 1107.373 1125.357 -547.6867
#>
#> Random effects:
#> Formula: ~days | rats
#> Structure: General positive-definite, Log-Cholesky parametrization
#> StdDev Corr
#> (Intercept) 10.7429538 (Intr)
#> days 0.5105284 -0.159
#> Residual 6.0146581
#>
#> Fixed effects: weight ~ days
#> Value Std.Error DF t-value p-value
#> (Intercept) 106.56762 2.2976758 119 46.38062 0
#> days 6.18571 0.1055885 119 58.58321 0
#> Correlation:
#> (Intr)
#> days -0.343
#>
#> Standardized Within-Group Residuals:
#> Min Q1 Med Q3 Max
#> -2.6370711 -0.5394662 0.1187649 0.4927166 2.6090856
#>
#> Number of Observations: 150
#> Number of Groups: 30模型输出结果中,固定效应中的截距项 (Intercept) 对应 106.56762,斜率 days 对应 6.18571。Stan 模型中截距参数 alpha0 的后验估计是 106.332,斜率参数 beta_c 的后验估计是 6.188。对比 Stan 和 nlme 包的拟合结果,可以发现贝叶斯和频率方法的结果是非常接近的。截距参数 alpha0 可以看作小鼠的初始(出生)重量,斜率参数 beta_c 可以看作小鼠的生长率 growth rate。
函数 lme() 的输出结果中,随机效应的随机截距标准差 10.7425835,对应 tau_alpha,表示每个小鼠的截距偏移量的波动。而随机斜率的标准差为 0.5105447,对应 tau_beta,相对随机截距标准差来说很小。残差标准差为 6.0146608,对应 tau_c,表示与小鼠无关的剩余量的波动,比如测量误差。总之,和 Stan 的结果有所不同,但相去不远。主要是前面的 Stan 模型没有考虑随机截距和随机斜率之间的相关性,这可以进一步调整 (Sorensen, Hohenstein, 和 Vasishth 2016) 。
#> Approximate 95% confidence intervals
#>
#>  Fixed effects:
#>                  lower       est.     upper
#> (Intercept) 102.017992 106.567619 111.11725
#> days          5.976638   6.185714   6.39479
#>
#>  Random Effects:
#>   Level: rats
#>                            lower       est.      upper
#> sd((Intercept))        7.5114418 10.7429538 15.3647008
#> sd(days)               0.3659082  0.5105284  0.7123078
#> cor((Intercept),days) -0.5692456 -0.1590187  0.3146036
#>
#>  Within-group standard error:
#>    lower     est.    upper
#> 5.197040 6.014658 6.960908
Stan 输出中,截距项 alpha、斜率项 beta 参数的标准差分别是 tau_alpha 和 tau_beta ,残差标准差参数 tau_c 的估计为 6.1。简单起见,没有考虑截距项和斜率项的相关性,即不考虑小鼠出生时的重量和生长率的相关性,一般来说,应该是有关系的。函数 lme() 的输出结果中给出了截距项和斜率项的相关性为 -0.343,随机截距和随机斜率的相关性为 -0.159。
计算与 Stan 输出中的截距项 alpha_c 对应的量,结合函数 lme() 的输出,截距、斜率加和之后,如下
值得注意,Stan 代码中对时间 days 做了中心化处理,即 \(x_t - \bar{x}\),目的是降低采样时参数 \(\alpha_i\) 和 \(\beta_i\) 之间的相关性,而在拟合函数 lme() 中没有做处理,因此,结果无需转化,而且更容易解释。
#>
#> Call:
#> lm(formula = weight ~ days, data = rats_data)
#>
#> Residuals:
#>     Min      1Q  Median      3Q     Max
#> -38.253 -11.278   0.197   7.647  64.047
#>
#> Coefficients:
#>             Estimate Std. Error t value Pr(>|t|)
#> (Intercept) 106.5676     3.2099   33.20   <2e-16 ***
#> days          6.1857     0.1331   46.49   <2e-16 ***
#> ---
#> Signif. codes:  0 '***' 0.001 '**' 0.01 '*' 0.05 '.' 0.1 ' ' 1
#>
#> Residual standard error: 16.13 on 148 degrees of freedom
#> Multiple R-squared:  0.9359, Adjusted R-squared:  0.9355
#> F-statistic:  2161 on 1 and 148 DF,  p-value: < 2.2e-16
采用简单线性模型即可获得与 nlme 包非常接近的估计结果,主要是小鼠重量的分布比较正态,且随时间的变化非常线性。
35.4.2 lavaan
lavaan 包 (Rosseel 2012) 主要是用来拟合结构方程模型,而生长曲线模型可以放在该框架下。所以,也可以用 lavaan 包来拟合,并且,它提供的函数 growth() 可以直接拟合生长曲线模型。
library(lavaan)
# 设置矩阵 y 的列名
colnames(y) <- c("t1","t2","t3","t4","t5")
rats_growt_model <- "
  # intercept and slope with fixed coefficients
  intercept =~ 1*t1 + 1*t2 + 1*t3 + 1*t4 + 1*t5
  days =~ 0*t1 + 1*t2 + 2*t3 + 3*t4 + 4*t5

  # if we fix the variances to be equal, the models are now identical.
  t1 ~~ resvar*t1
  t2 ~~ resvar*t2
  t3 ~~ resvar*t3
  t4 ~~ resvar*t4
  t5 ~~ resvar*t5
"
其中,算子符号 =~ 定义潜变量,~~ 定义残差协方差,intercept 表示截距, days 表示斜率。假定 5 次测量的测量误差(组内方差)是相同的。拟合模型的代码如下:
提供函数 summary() 获得模型输出,结果如下:
#> lavaan 0.6.16 ended normally after 87 iterations
#>
#>   Estimator                                         ML
#>   Optimization method                           NLMINB
#>   Number of model parameters                        10
#>   Number of equality constraints                     4
#>
#>   Number of observations                            30
#>
#> Model Test User Model:
#>
#>   Test statistic                               106.203
#>   Degrees of freedom                                14
#>   P-value (Chi-square)                           0.000
#>
#> Model Test Baseline Model:
#>
#>   Test statistic                               247.075
#>   Degrees of freedom                                10
#>   P-value                                        0.000
#>
#> User Model versus Baseline Model:
#>
#>   Comparative Fit Index (CFI)                    0.611
#>   Tucker-Lewis Index (TLI)                       0.722
#>
#> Loglikelihood and Information Criteria:
#>
#>   Loglikelihood user model (H0)               -548.029
#>   Loglikelihood unrestricted model (H1)       -494.927
#>
#>   Akaike (AIC)                                1108.057
#>   Bayesian (BIC)                              1116.465
#>   Sample-size adjusted Bayesian (SABIC)       1097.783
#>
#> Root Mean Square Error of Approximation:
#>
#>   RMSEA                                          0.469
#>   90 Percent confidence interval - lower         0.388
#>   90 Percent confidence interval - upper         0.554
#>   P-value H_0: RMSEA <= 0.050                    0.000
#>   P-value H_0: RMSEA >= 0.080                    1.000
#>
#> Standardized Root Mean Square Residual:
#>
#>   SRMR                                           0.151
#>
#> Parameter Estimates:
#>
#>   Standard errors                             Standard
#>   Information                                 Expected
#>   Information saturated (h1) model          Structured
#>
#> Latent Variables:
#>                    Estimate  Std.Err  z-value  P(>|z|)
#>   intercept =~
#>     t1                1.000
#>     t2                1.000
#>     t3                1.000
#>     t4                1.000
#>     t5                1.000
#>   days =~
#>     t1                0.000
#>     t2                1.000
#>     t3                2.000
#>     t4                3.000
#>     t5                4.000
#>
#> Covariances:
#>                    Estimate  Std.Err  z-value  P(>|z|)
#>   intercept ~~
#>     days              8.444    8.521    0.991    0.322
#>
#> Intercepts:
#>                    Estimate  Std.Err  z-value  P(>|z|)
#>    .t1                0.000
#>    .t2                0.000
#>    .t3                0.000
#>    .t4                0.000
#>    .t5                0.000
#>     intercept       156.053    2.123   73.516    0.000
#>     days             43.300    0.727   59.582    0.000
#>
#> Variances:
#>                    Estimate  Std.Err  z-value  P(>|z|)
#>    .t1      (rsvr)   36.176    5.393    6.708    0.000
#>    .t2      (rsvr)   36.176    5.393    6.708    0.000
#>    .t3      (rsvr)   36.176    5.393    6.708    0.000
#>    .t4      (rsvr)   36.176    5.393    6.708    0.000
#>    .t5      (rsvr)   36.176    5.393    6.708    0.000
#>     intrcpt         113.470   35.052    3.237    0.001
#>     days             12.226    4.126    2.963    0.003
输出结果显示 lavaan 包的函数 growth() 采用极大似然估计方法。协方差部分 Covariances: 随机效应中斜率和截距的协方差。截距部分 Intercepts: 对应于混合效应模型的固定效应部分。方差部分 Variances: 对应于混合效应模型的随机效应部分,包括残差方差、斜率和截距的方差。不难看出,这和前面 nlme 包的输出结果差别很大。原因是 lavaan 包将测量的次序从 0 开始计,0 代表小鼠出生后的第 8 天。也就是说,lavaan 采用的是次序标记,而不是实际数据。将测量发生的时间(第几天)换算成次序(第几次),并从 0 开始计,则函数 lme() 的输出和函数 growth() 就一致了。
# 重新组织数据
days2 <- rep(c(0, 1, 2, 3, 4), each = 30)
rats_data2 <- data.frame(weight = weight, rats = rats, days = days2)
# ML 方法估计模型参数
rats_lme2 <- lme(data = rats_data2, fixed = weight ~ days, random = ~ days | rats, method = "ML")
summary(rats_lme2)
#> Linear mixed-effects model fit by maximum likelihood
#> Data: rats_data2
#> AIC BIC logLik
#> 1108.057 1126.121 -548.0287
#>
#> Random effects:
#> Formula: ~days | rats
#> Structure: General positive-definite, Log-Cholesky parametrization
#> StdDev Corr
#> (Intercept) 10.652390 (Intr)
#> days 3.496588 0.227
#> Residual 6.014611
#>
#> Fixed effects: weight ~ days
#> Value Std.Error DF t-value p-value
#> (Intercept) 156.0533 2.1370188 119 73.02385 0
#> days 43.3000 0.7316143 119 59.18419 0
#> Correlation:
#> (Intr)
#> days 0.026
#>
#> Standardized Within-Group Residuals:
#> Min Q1 Med Q3 Max
#> -2.6317213 -0.5421566 0.1154352 0.4948021 2.6188195
#>
#> Number of Observations: 150
#> Number of Groups: 30可以看到函数 growth() 给出的截距和斜率的协方差估计为 8.444,函数 lme() 给出对应截距和斜率的标准差分别是 10.652390 和 3.496588,它们的相关系数为 0.227,则函数 lme() 给出的协方差估计为 10.652390*3.496588*0.227 ,即 8.455,协方差估计比较一致。同理,比较两个输出结果中的其它成分,函数 growth() 给出的残差方差估计为 36.176,则残差标准差估计为 6.0146,结合函数 lme() 给出的 Random effects: 中 Residual,结果完全一样。函数 growth() 给出的 Intercepts: 对应于函数 lme() 给出的固定效应部分,结果也是完全一样。
针对模型拟合对象 rats_growth_fit ,除了函数 summary() 可以汇总结果,lavaan 包还提供 AIC() 、 BIC() 和 logLik() 等函数,分别可以提取 AIC、BIC 和对数似然值, AIC() 和 logLik() 结果与前面的函数 lme() 的输出是一样的,而 BIC() 不同。
35.4.3 lme4
当采用 lme4 包拟合数据的时候,发现输出结果与 nlme 包几乎相同。
#> Linear mixed model fit by REML ['lmerMod']
#> Formula: weight ~ days + (days | rats)
#>    Data: rats_data
#>
#> REML criterion at convergence: 1095.4
#>
#> Scaled residuals:
#>     Min      1Q  Median      3Q     Max
#> -2.6371 -0.5395  0.1188  0.4927  2.6091
#>
#> Random effects:
#>  Groups   Name        Variance Std.Dev. Corr
#>  rats     (Intercept) 115.4239 10.7435
#>           days          0.2607  0.5106  -0.16
#>  Residual              36.1753  6.0146
#> Number of obs: 150, groups:  rats, 30
#>
#> Fixed effects:
#>             Estimate Std. Error t value
#> (Intercept) 106.5676     2.2978   46.38
#> days          6.1857     0.1056   58.58
#>
#> Correlation of Fixed Effects:
#>      (Intr)
#> days -0.343
35.4.4 glmmTMB
glmmTMB 包基于 Template Model Builder (TMB) ,拟合广义线性混合效应模型,公式语法与 lme4 包一致。
 Family: gaussian  ( identity )
Formula:          weight ~ days + (days | rats)
Data: rats_data

     AIC      BIC   logLik deviance df.resid
  1107.4   1125.4   -547.7   1095.4      146

Random effects:

Conditional model:
 Groups   Name        Variance Std.Dev. Corr
 rats     (Intercept) 115.4195 10.7433
          days          0.2607  0.5106  -0.16
 Residual              36.1756  6.0146
Number of obs: 150, groups:  rats, 30

Dispersion estimate for gaussian family (sigma^2): 36.2

Conditional model:
            Estimate Std. Error z value Pr(>|z|)
(Intercept) 106.5676     2.2977   46.38   <2e-16 ***
days          6.1857     0.1056   58.58   <2e-16 ***
---
Signif. codes:  0 ‘***’ 0.001 ‘**’ 0.01 ‘*’ 0.05 ‘.’ 0.1 ‘ ’ 1
结果与 nlme 包完全一样。
35.4.5 MASS
MASS 包的结果与前面完全一致。
rats_mass <- MASS::glmmPQL(
  fixed = weight ~ days, random = ~ days | rats,
  data = rats_data, family = gaussian(), verbose = FALSE
)
summary(rats_mass)
#> Linear mixed-effects model fit by maximum likelihood
#> Data: rats_data
#> AIC BIC logLik
#> NA NA NA
#>
#> Random effects:
#> Formula: ~days | rats
#> Structure: General positive-definite, Log-Cholesky parametrization
#> StdDev Corr
#> (Intercept) 10.4944816 (Intr)
#> days 0.4994805 -0.15
#> Residual 6.0146666
#>
#> Variance function:
#> Structure: fixed weights
#> Formula: ~invwt
#> Fixed effects: weight ~ days
#> Value Std.Error DF t-value p-value
#> (Intercept) 106.56762 2.2742880 119 46.85757 0
#> days 6.18571 0.1045114 119 59.18699 0
#> Correlation:
#> (Intr)
#> days -0.343
#>
#> Standardized Within-Group Residuals:
#> Min Q1 Med Q3 Max
#> -2.6316771 -0.5421384 0.1154447 0.4947988 2.6187966
#>
#> Number of Observations: 150
#> Number of Groups: 3035.4.6 spaMM
spaMM 包的结果与前面完全一致。
#> formula: weight ~ days + (days | rats)
#> ML: Estimation of ranCoefs and phi by ML.
#>     Estimation of fixed effects by ML.
#> Estimation of phi by 'outer' ML, maximizing logL.
#> family: gaussian( link = identity )
#>  ------------ Fixed effects (beta) ------------
#>             Estimate Cond. SE t-value
#> (Intercept)  106.568   2.2591   47.17
#> days           6.186   0.1038   59.58
#>  --------------- Random effects ---------------
#> Family: gaussian( link = identity )
#>          --- Random-coefficients Cov matrices:
#>  Group        Term   Var.   Corr.
#>   rats (Intercept)  110.1
#>   rats        days 0.2495 -0.1507
#> # of obs: 150; # of groups: rats, 30
#>  -------------- Residual variance  ------------
#> phi estimate was 36.1757
#>  ------------- Likelihood values  -------------
#>                         logLik
#> logL       (p_v(h)): -548.0287
--------------- Random effects ---------------
Family: gaussian( link = identity )
--- Random-coefficients Cov matrices:
Group Term Var. Corr.
rats (Intercept) 110.1
rats days 0.2495 -0.1507
# of obs: 150; # of groups: rats, 30 随机效应的截距方差 110.1,斜率方差 0.2495,则标准差分别是 10.49 和 0.499,相关性为 -0.1507。
残差方差为 36.1755,则标准差为 6.0146。
35.4.7 hglm
hglm 包 (Rönnegård, Shen, 和 Alam 2010) 可以拟合分层广义线性模型,线性混合效应模型和广义线性混合效应模型,随机效应和响应变量服从的分布可以很广泛,使用语法与 lme4 包一样。
Call:
hglm2.formula(meanmodel = weight ~ days + (days | rats), data = rats_data)

----------
MEAN MODEL
----------

Summary of the fixed effects estimates:

            Estimate Std. Error t-value Pr(>|t|)
(Intercept) 106.5676     2.1787   48.91   <2e-16 ***
days          6.1857     0.1029   60.13   <2e-16 ***
---
Signif. codes:  0 ‘***’ 0.001 ‘**’ 0.01 ‘*’ 0.05 ‘.’ 0.1 ‘ ’ 1
Note: P-values are based on 103 degrees of freedom

Summary of the random effects estimates:

                    Estimate Std. Error
(Intercept)| rats:1  -0.1705     5.3422
(Intercept)| rats:2  -9.8655     5.3422
(Intercept)| rats:3   2.7201     5.3422
...
NOTE: to show all the random effects, use print(summary(hglm.object), print.ranef = TRUE).

Summary of the random effects estimates:

             Estimate Std. Error
days| rats:1  -0.1213      0.229
days| rats:2   0.7260      0.229
days| rats:3   0.3280      0.229
...
NOTE: to show all the random effects, use print(summary(hglm.object), print.ranef = TRUE).

----------------
DISPERSION MODEL
----------------

NOTE: h-likelihood estimates through EQL can be biased.

Dispersion parameter for the mean model:
[1] 37.09572

Model estimates for the dispersion term:

Link = log

Effects:
  Estimate Std. Error
    3.6135     0.1391

Dispersion = 1 is used in Gamma model on deviances to calculate the standard error(s).

Dispersion parameter for the random effects:
[1] 103.4501   0.2407

Dispersion model for the random effects:

Link = log

Effects:
.|Random1
  Estimate Std. Error
    4.6391     0.3069

.|Random2
  Estimate Std. Error
   -1.4241     0.2920

Dispersion = 1 is used in Gamma model on deviances to calculate the standard error(s).

EQL estimation converged in 5 iterations.
固定效应的截距和斜率都是和 nlme 包的输出结果一致。值得注意,随机效应和模型残差都是以发散参数(Dispersion parameter)来表示的,模型残差方差为 37.09572,则标准差为 6.0906,随机效应的随机截距和随机斜率的方差分别为 103.4501 和 0.2407,则标准差分别为 10.1710 和 0.4906,这与 nlme 包的结果也是一致的。
35.4.8 mgcv
先考虑一个变截距的混合效应模型
\[ y_{ij} = \beta_0 + \beta_1 * x_j + \alpha_i + \epsilon_{ij}, \quad i = 1,2,\ldots,30. \quad j = 1,2,3,4,5 \]
假设随机效应服从独立同正态分布,等价于添加一个岭惩罚。mgcv 包拟合广义可加模型。
其中, bs = "re" re 是 Random effects 的简写,在似然函数中,随机效应作为一个岭惩罚的形式。
#>
#> Family: gaussian
#> Link function: identity
#>
#> Formula:
#> weight ~ days + s(rats, bs = "re")
#>
#> Parametric coefficients:
#>              Estimate Std. Error t value Pr(>|t|)
#> (Intercept) 106.56762    3.03797   35.08   <2e-16 ***
#> days          6.18571    0.06766   91.42   <2e-16 ***
#> ---
#> Signif. codes:  0 '***' 0.001 '**' 0.01 '*' 0.05 '.' 0.1 ' ' 1
#>
#> Approximate significance of smooth terms:
#>           edf Ref.df     F p-value
#> s(rats) 27.14     29 14.63  <2e-16 ***
#> ---
#> Signif. codes:  0 '***' 0.001 '**' 0.01 '*' 0.05 '.' 0.1 ' ' 1
#>
#> R-sq.(adj) =  0.983   Deviance explained = 98.6%
#> GCV = 83.533  Scale est. = 67.303    n = 150
其中,残差的方差 Scale est. = 67.303 ,则标准差为 \(\sigma_{\epsilon} = 8.2038\) 。随机效应的标准差如下
rescale = TRUE 表示恢复至原数据的尺度,标准差 \(\sigma_{\alpha} = 14.033\)。可以看到,固定效应和随机效应的估计结果与 nlme 包等完全一致。
若考虑变截距和变斜率的混合效应模型,
rats_gam1 <- gam(
  weight ~ days + s(rats, bs = "re") + s(rats, by = days, bs = "re"),
  data = rats_data, method = "REML"
)
summary(rats_gam1)
#>
#> Family: gaussian
#> Link function: identity
#>
#> Formula:
#> weight ~ days + s(rats, bs = "re") + s(rats, by = days, bs = "re")
#>
#> Parametric coefficients:
#> Estimate Std. Error t value Pr(>|t|)
#> (Intercept) 106.5676 2.2365 47.65 <2e-16 ***
#> days 6.1857 0.1028 60.18 <2e-16 ***
#> ---
#> Signif. codes: 0 '***' 0.001 '**' 0.01 '*' 0.05 '.' 0.1 ' ' 1
#>
#> Approximate significance of smooth terms:
#> edf Ref.df F p-value
#> s(rats) 21.80 29 183.9 <2e-16 ***
#> s(rats):days 23.47 29 201.8 <2e-16 ***
#> ---
#> Signif. codes: 0 '***' 0.001 '**' 0.01 '*' 0.05 '.' 0.1 ' ' 1
#>
#> R-sq.(adj) = 0.991 Deviance explained = 99.4%
#> -REML = 547.89 Scale est. = 36.834 n = 150输出结果中,固定效应部分的结果和 nlme 包完全一样。
#>
#> Standard deviations and 0.95 confidence intervals:
#>
#>                 std.dev     lower      upper
#> s(rats)      10.3107538 7.2978205 14.5675882
#> s(rats):days  0.4916736 0.3571229  0.6769181
#> scale         6.0691017 5.2454835  7.0220401
#>
#> Rank: 3/3
输出结果中,依次是随机效应的截距、斜率和残差的标准差(标准偏差),结果和 nlme 包非常接近。
mgcv 包还提供函数 gamm(),它将混合效应和固定效应分开,在拟合 LMM 模型时,它类似 nlme 包的函数 lme()。返回一个含有 lme 和 gam 两个元素的列表,前者包含随机效应的估计,后者是固定效应的估计,固定效应中可以添加样条(或样条表示的简单随机效益,比如本节前面提及的模型)。实际上,函数 gamm() 分别调用 nlme 包和 MASS 包来拟合 LMM 模型和 GLMM 模型。
rats_gamm <- gamm(weight ~ days, random = list(rats = ~days), method = "REML", data = rats_data)
# LME
summary(rats_gamm$lme)
#> Linear mixed-effects model fit by REML
#> Data: strip.offset(mf)
#> AIC BIC logLik
#> 1107.373 1125.357 -547.6867
#>
#> Random effects:
#> Formula: ~days | rats
#> Structure: General positive-definite, Log-Cholesky parametrization
#> StdDev Corr
#> (Intercept) 10.7433332 (Intr)
#> days 0.5105577 -0.159
#> Residual 6.0146119
#>
#> Fixed effects: y ~ X - 1
#> Value Std.Error DF t-value p-value
#> X(Intercept) 106.56762 2.2977301 119 46.37952 0
#> Xdays 6.18571 0.1055931 119 58.58069 0
#> Correlation:
#> X(Int)
#> Xdays -0.343
#>
#> Standardized Within-Group Residuals:
#> Min Q1 Med Q3 Max
#> -2.6371079 -0.5394997 0.1187534 0.4927191 2.6091109
#>
#> Number of Observations: 150
#> Number of Groups: 30#>
#> Family: gaussian
#> Link function: identity
#>
#> Formula:
#> weight ~ days
#>
#> Parametric coefficients:
#> Estimate Std. Error t value Pr(>|t|)
#> (Intercept) 106.5676 2.2977 46.38 <2e-16 ***
#> days 6.1857 0.1056 58.58 <2e-16 ***
#> ---
#> Signif. codes: 0 '***' 0.001 '**' 0.01 '*' 0.05 '.' 0.1 ' ' 1
#>
#>
#> R-sq.(adj) = 0.935
#> Scale est. = 36.176 n = 15035.5 贝叶斯学派
35.5.1 rstan
初始化模型参数,设置采样算法的参数。
接下来,基于重复测量数据,建立线性生长曲线模型:
\[ \begin{aligned} \alpha_c &\sim \mathcal{N}(0,100) \quad \beta_c \sim \mathcal{N}(0,100) \\ \tau^2_{\alpha} &\sim \mathrm{inv\_gamma}(0.001, 0.001) \\ \tau^2_{\beta} &\sim \mathrm{inv\_gamma}(0.001, 0.001) \\ \tau^2_c &\sim \mathrm{inv\_gamma}(0.001, 0.001) \\ \alpha_n &\sim \mathcal{N}(\alpha_c, \tau_{\alpha}) \quad \beta_n \sim \mathcal{N}(\beta_c, \tau_{\beta}) \\ y_{nt} &\sim \mathcal{N}(\alpha_n + \beta_n * (x_t - \bar{x}), \tau_c) \\ & n = 1,2,\ldots,N \quad t = 1,2,\ldots,T \end{aligned} \]
其中, \(\alpha_c,\beta_c,\tau_c,\tau_{\alpha},\tau_{\beta}\) 为无信息先验,\(\bar{x} = 22\) 表示第 22 天,\(N = 30\) 和 \(T = 5\) 分别表示实验中的小鼠数量和测量次数,下面采用 Stan 编码、编译、采样和拟合模型。
rats_fit <- stan(
  model_name = "rats",
  model_code = "
  data {
    int<lower=0> N;
    int<lower=0> T;
    vector[T] x;
    matrix[N,T] y;
    real xbar;
  }
  parameters {
    vector[N] alpha;
    vector[N] beta;

    real alpha_c;
    real beta_c;          // beta.c in original bugs model

    real<lower=0> tausq_c;
    real<lower=0> tausq_alpha;
    real<lower=0> tausq_beta;
  }
  transformed parameters {
    real<lower=0> tau_c;       // sigma in original bugs model
    real<lower=0> tau_alpha;
    real<lower=0> tau_beta;

    tau_c = sqrt(tausq_c);
    tau_alpha = sqrt(tausq_alpha);
    tau_beta = sqrt(tausq_beta);
  }
  model {
    alpha_c ~ normal(0, 100);
    beta_c ~ normal(0, 100);
    tausq_c ~ inv_gamma(0.001, 0.001);
    tausq_alpha ~ inv_gamma(0.001, 0.001);
    tausq_beta ~ inv_gamma(0.001, 0.001);
    alpha ~ normal(alpha_c, tau_alpha); // vectorized
    beta ~ normal(beta_c, tau_beta);  // vectorized
    for (n in 1:N)
      for (t in 1:T)
        y[n,t] ~ normal(alpha[n] + beta[n] * (x[t] - xbar), tau_c);
  }
  generated quantities {
    real alpha0;
    alpha0 = alpha_c - xbar * beta_c;
  }
  ",
  data = list(N = N, T = T, y = y, x = x, xbar = xbar),
  chains = chains, init = init, iter = iter,
  verbose = FALSE, refresh = 0, seed = 20190425
)
模型输出结果如下:
#> Inference for Stan model: rats.
#> 4 chains, each with iter=1000; warmup=500; thin=1;
#> post-warmup draws per chain=500, total post-warmup draws=2000.
#>
#>               mean se_mean   sd   2.5%    25%    50%    75%  97.5% n_eff Rhat
#> alpha_c      242.5     0.1  2.6  237.3  240.8  242.5  244.2  247.6  2200    1
#> beta_c         6.2     0.0  0.1    6.0    6.1    6.2    6.3    6.4  2134    1
#> tausq_c       37.3     0.2  5.4   28.3   33.4   36.8   40.5   49.0  1090    1
#> tausq_alpha  218.5     1.5 62.1  127.3  174.5  207.2  252.1  369.2  1787    1
#> tausq_beta     0.3     0.0  0.1    0.1    0.2    0.3    0.3    0.5  1340    1
#> tau_c          6.1     0.0  0.4    5.3    5.8    6.1    6.4    7.0  1096    1
#> tau_alpha     14.6     0.0  2.0   11.3   13.2   14.4   15.9   19.2  1871    1
#> tau_beta       0.5     0.0  0.1    0.4    0.5    0.5    0.6    0.7  1304    1
#> alpha0       106.4     0.1  3.5   99.4  104.0  106.4  108.7  113.4  2300    1
#> lp__        -438.6     0.3  6.6 -452.7 -442.9 -438.1 -434.1 -426.3   703    1
#>
#> Samples were drawn using NUTS(diag_e) at Wed Oct 25 15:38:57 2023.
#> For each parameter, n_eff is a crude measure of effective sample size,
#> and Rhat is the potential scale reduction factor on split chains (at
#> convergence, Rhat=1).
alpha_c 表示小鼠 5 次测量的平均重量,beta_c 表示小鼠体重的增长率,\(\alpha_i,\beta_i\) 分别表示第 \(i\) 只小鼠在第 22 天(第 3 次测量或 \(x_t = \bar{x}\) )的重量和增长率(每日增加的重量)。
对于分量众多的参数向量,比较适合用岭线图展示后验分布,下面调用 bayesplot 包绘制参数向量 \(\boldsymbol{\alpha},\boldsymbol{\beta}\) 的后验分布。
# plot(rats_fit, pars = "alpha", show_density = TRUE, ci_level = 0.8, outer_level = 0.95)
bayesplot::mcmc_areas_ridges(rats_fit, pars = paste0("alpha", "[", 1:30, "]")) +
scale_y_discrete(labels = scales::parse_format()) 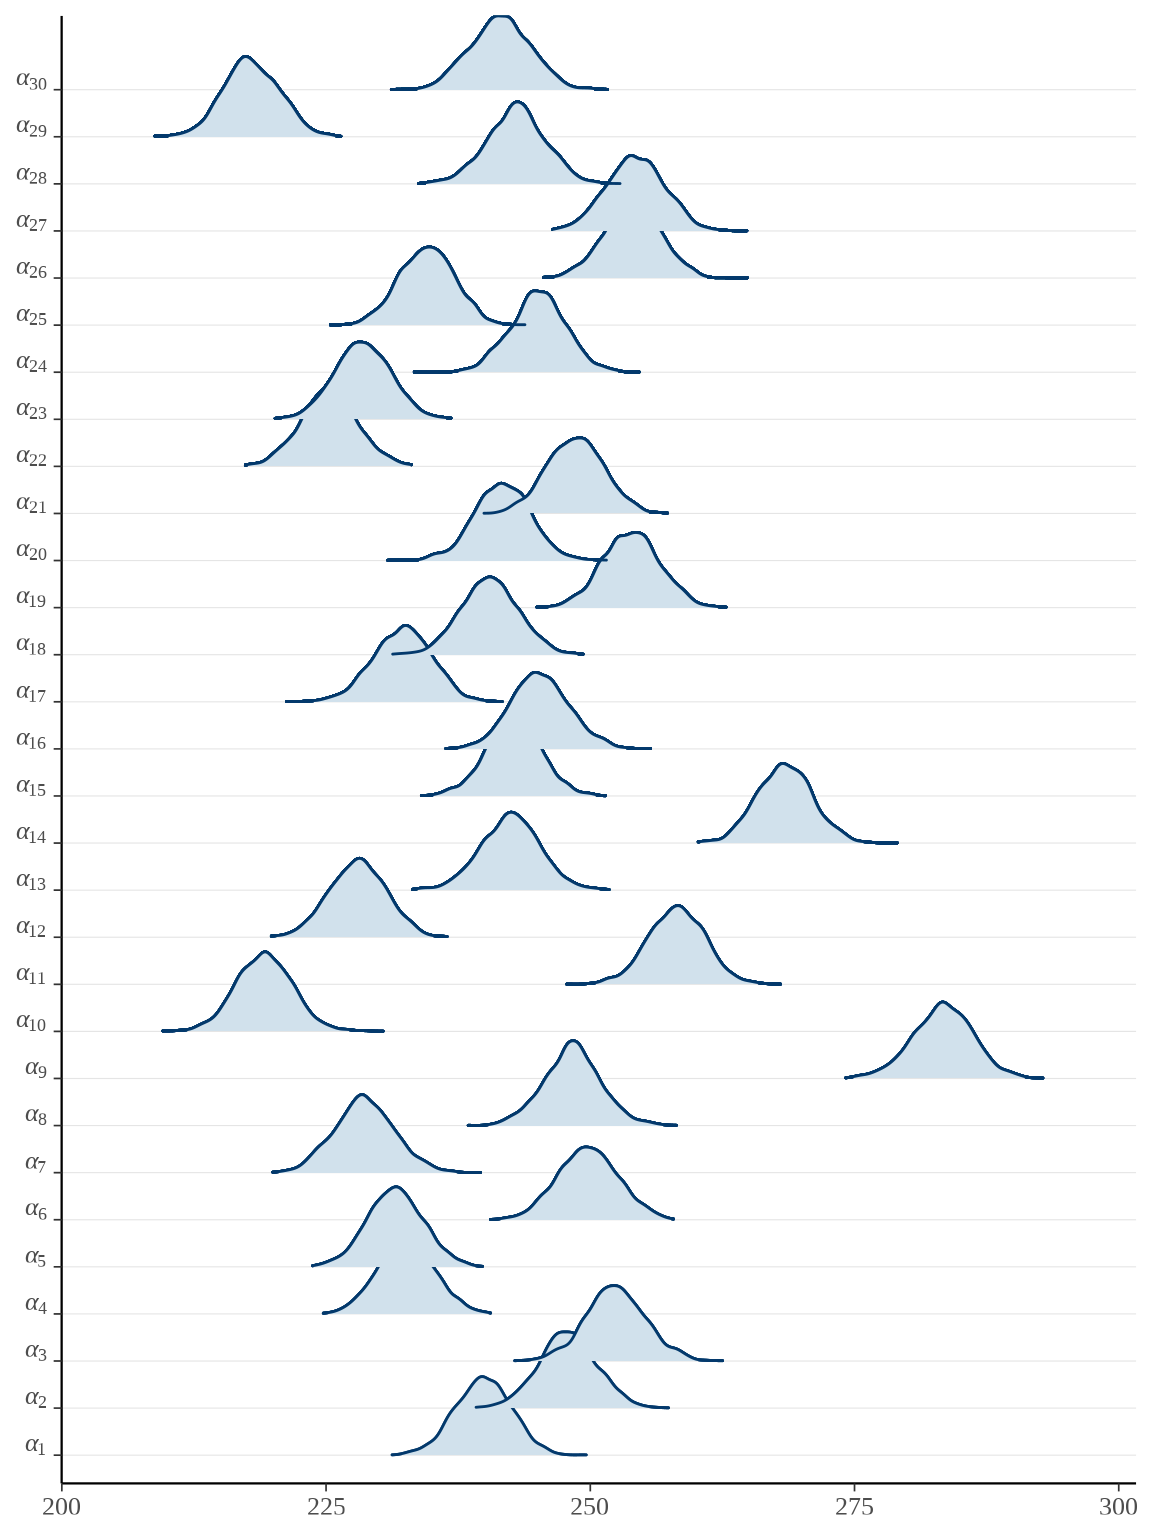
参数向量 \(\boldsymbol{\alpha}\) 的后验估计可以看作 \(x_t = \bar{x}\) 时小鼠的重量,上图即为各个小鼠重量的后验分布。
# plot(rats_fit, pars = "beta", ci_level = 0.8, outer_level = 0.95)
bayesplot::mcmc_areas_ridges(rats_fit, pars = paste0("beta", "[", 1:30, "]")) +
scale_y_discrete(labels = scales::parse_format()) 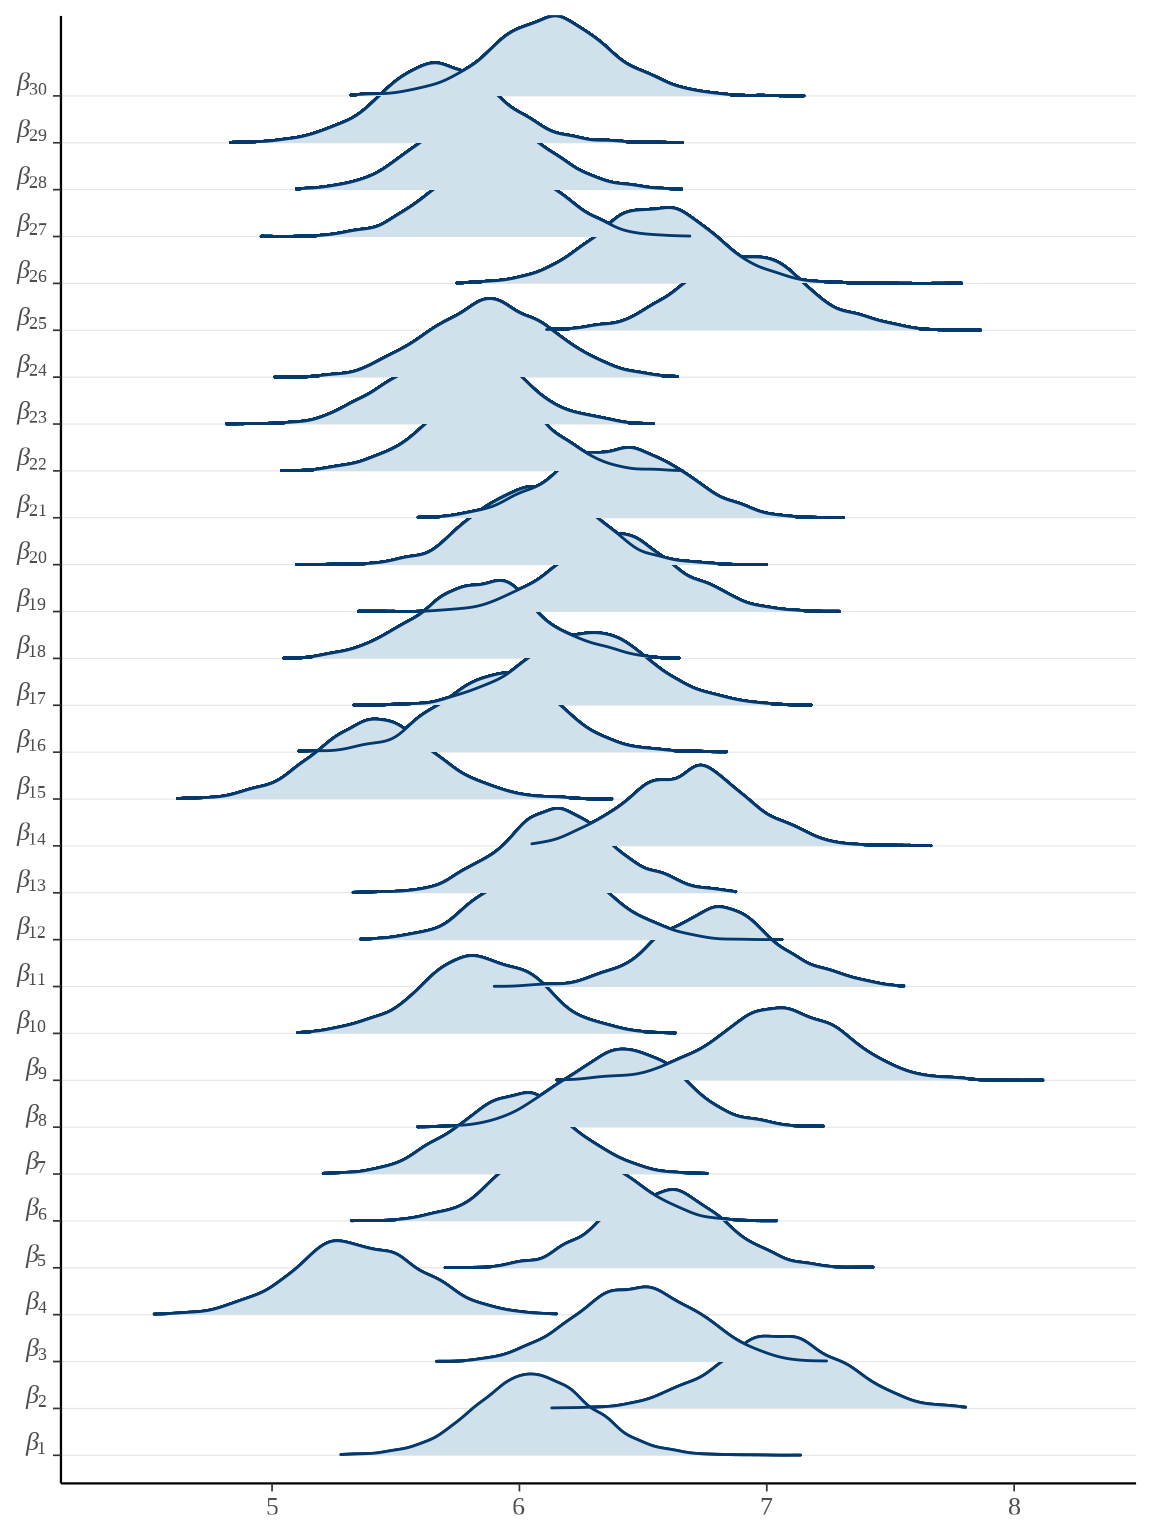
参数向量 \(\boldsymbol{\beta}\) 的后验估计可以看作是小鼠的重量的增长率,上图即为各个小鼠重量的增长率的后验分布。
35.5.2 cmdstanr
从 rstan 包转 cmdstanr 包是非常容易的,只要语法兼容,模型代码可以原封不动。
library(cmdstanr)
mod_rats <- cmdstan_model(
  stan_file = "code/rats.stan",
  compile = TRUE, cpp_options = list(stan_threads = TRUE)
)
fit_rats <- mod_rats$sample(
  data = list(N = N, T = T, y = y, x = x, xbar = xbar), # 数据
  chains = 2,            # 总链条数
  parallel_chains = 2,   # 并行数目
  iter_warmup = 1000,    # 每条链预处理的迭代次数
  iter_sampling = 1000,  # 每条链采样的迭代次数
  threads_per_chain = 2, # 每条链设置 2 个线程
  seed = 20232023,       # 随机数种子
  show_messages = FALSE, # 不显示消息
  adapt_delta = 0.9,     # 接受率
  refresh = 0 # 不显示采样迭代的进度
)
模型输出
# 显示除了参数 alpha 和 beta 以外的结果
vars <- setdiff(fit_rats$metadata()$stan_variables, c("alpha", "beta"))
fit_rats$summary(variables = vars)
#> # A tibble: 10 × 10
#> variable mean median sd mad q5 q95 rhat ess_bulk
#> <chr> <num> <num> <num> <num> <num> <num> <num> <num>
#> 1 lp__ -438. -438. 6.82 7.26 -450. -427. 1.00 580.
#> 2 alpha_c 243. 243. 2.68 2.53 238. 247. 1.00 2315.
#> 3 beta_c 6.19 6.19 0.106 0.106 6.02 6.36 0.999 3106.
#> 4 tausq_c 37.3 36.8 5.52 5.36 29.2 46.9 1.00 1015.
#> 5 tausq_alp… 215. 206. 61.7 56.2 136. 334. 1.00 2117.
#> 6 tausq_beta 0.271 0.258 0.0941 0.0884 0.145 0.438 1.00 1526.
#> 7 tau_c 6.09 6.06 0.447 0.442 5.40 6.85 1.00 1015.
#> 8 tau_alpha 14.5 14.3 2.03 1.99 11.7 18.3 1.00 2117.
#> 9 tau_beta 0.513 0.508 0.0880 0.0879 0.380 0.662 1.00 1526.
#> 10 alpha0 106. 106. 3.57 3.56 101. 112. 1.00 2843.
#> # ℹ 1 more variable: ess_tail <num>诊断信息
35.5.3 brms
brms 包是基于 rstan 包的,基于 Stan 语言做贝叶斯推断,提供与 lme4 包一致的公式语法,且扩展了模型种类。
 Family: gaussian
  Links: mu = identity; sigma = identity
Formula: weight ~ days + (days | rats)
   Data: rats_data (Number of observations: 150)
  Draws: 4 chains, each with iter = 2000; warmup = 1000; thin = 1;
         total post-warmup draws = 4000

Group-Level Effects:
~rats (Number of levels: 30)
                    Estimate Est.Error l-95% CI u-95% CI Rhat Bulk_ESS Tail_ESS
sd(Intercept)          11.27      2.23     7.36    16.08 1.00     2172     2939
sd(days)                0.54      0.09     0.37     0.74 1.00     1380     2356
cor(Intercept,days)    -0.11      0.24    -0.53     0.39 1.00      920     1541

Population-Level Effects:
          Estimate Est.Error l-95% CI u-95% CI Rhat Bulk_ESS Tail_ESS
Intercept   106.47      2.47   101.61   111.23 1.00     2173     2768
days          6.18      0.11     5.96     6.41 1.00     1617     2177

Family Specific Parameters:
      Estimate Est.Error l-95% CI u-95% CI Rhat Bulk_ESS Tail_ESS
sigma     6.15      0.47     5.30     7.14 1.00     1832     3151

Draws were sampled using sampling(NUTS). For each parameter, Bulk_ESS
and Tail_ESS are effective sample size measures, and Rhat is the potential
scale reduction factor on split chains (at convergence, Rhat = 1).
35.5.4 rstanarm
rstanarm 包与 brms 包类似,区别是前者预编译了 Stan 模型,后者根据输入数据和模型编译即时编译,此外,后者支持的模型范围更加广泛。
Model Info:
 function:     stan_lmer
 family:       gaussian [identity]
 formula:      weight ~ days + (days | rats)
 algorithm:    sampling
 sample:       4000 (posterior sample size)
 priors:       see help('prior_summary')
 observations: 150
 groups:       rats (30)

Estimates:
                                      mean    sd      10%     50%     90%
(Intercept)                         106.575   2.236 103.789 106.559 109.415
days                                  6.187   0.111   6.048   6.185   6.329
sigma                                 6.219   0.497   5.626   6.183   6.862
Sigma[rats:(Intercept),(Intercept)] 103.927  42.705  57.329  98.128 159.086
Sigma[rats:days,(Intercept)]         -0.545   1.492  -2.361  -0.402   1.162
Sigma[rats:days,days]                 0.304   0.112   0.181   0.285   0.445

MCMC diagnostics
                                    mcse  Rhat  n_eff
(Intercept)                         0.043 1.000 2753
days                                0.003 1.005 1694
sigma                               0.015 1.001 1172
Sigma[rats:(Intercept),(Intercept)] 1.140 1.000 1403
Sigma[rats:days,(Intercept)]        0.054 1.006  772
Sigma[rats:days,days]               0.003 1.000 1456

For each parameter, mcse is Monte Carlo standard error,
n_eff is a crude measure of effective sample size,
and Rhat is the potential scale reduction factor
on split chains (at convergence Rhat=1).
固定效应的部分,截距和斜率如下:
Estimates:
                                      mean    sd      10%     50%     90%
(Intercept)                         106.575   2.236 103.789 106.559 109.415
days                                  6.187   0.111   6.048   6.185   6.329
模型残差的标准差 sigma、随机效应 Sigma 的随机截距的方差 103.927 、随机斜率的方差 0.304 及其协方差 -0.545。
sigma                                 6.219   0.497   5.626   6.183   6.862
Sigma[rats:(Intercept),(Intercept)] 103.927  42.705  57.329  98.128 159.086
Sigma[rats:days,(Intercept)]         -0.545   1.492  -2.361  -0.402   1.162
Sigma[rats:days,days]                 0.304   0.112   0.181   0.285   0.445
rstanarm 和 brms 包的结果基本一致的。
35.5.5 blme
blme 包 (Chung 等 2013) 基于 lme4 包 (Bates 等 2015) 拟合贝叶斯线性混合效应模型。参考前面 rstan 小节中关于模型参数的先验设置,下面将残差方差的先验设置为逆伽马分布,随机效应的协方差设置为扁平分布。发现拟合结果和 nlme 和 lme4 包的几乎一样。
rats_blme <- blme::blmer(
  weight ~ days + (days | rats), data = rats_data,
  resid.prior = invgamma, cov.prior = NULL
)
summary(rats_blme)
#> Resid prior: invgamma(shape = 0, scale = 0, posterior.scale = var)
#> Prior dev : 7.1328
#>
#> Linear mixed model fit by REML ['blmerMod']
#> Formula: weight ~ days + (days | rats)
#> Data: rats_data
#>
#> REML criterion at convergence: 1095.4
#>
#> Scaled residuals:
#> Min 1Q Median 3Q Max
#> -2.6697 -0.5440 0.1202 0.4968 2.6317
#>
#> Random effects:
#> Groups Name Variance Std.Dev. Corr
#> rats (Intercept) 116.3517 10.7866
#> days 0.2623 0.5121 -0.16
#> Residual 35.3891 5.9489
#> Number of obs: 150, groups: rats, 30
#>
#> Fixed effects:
#> Estimate Std. Error t value
#> (Intercept) 106.5676 2.2977 46.38
#> days 6.1857 0.1056 58.58
#>
#> Correlation of Fixed Effects:
#> (Intr)
#> days -0.343与 lme4 包的函数 lmer() 所不同的是参数 resid.prior 、fixef.prior 和 cov.prior ,它们设置参数的先验分布,其它参数的含义同 lme4 包。resid.prior = invgamma 表示残差方差参数使用逆伽马分布,cov.prior = NULL 表示随机效应的协方差参数使用扁平先验 flat priors。
35.5.6 rjags
rjags (Plummer 2021) 是 JAGS 软件的 R 语言接口,可以拟合分层正态模型,再借助 coda 包 (Plummer 等 2006) 可以分析 JAGS 返回的各项数据。
JAGS 代码和 Stan 代码有不少相似之处,最大的共同点在于以直观的统计模型的符号表示编码模型,仿照 Stan 代码, JAGS 编码的模型(BUGS 代码)如下:
model {
  alpha_c ~ dnorm(0, 1.0E-4);
  beta_c ~ dnorm(0, 1.0E-4);

  tau_c ~ dgamma(0.001, 0.001);
  tau_alpha ~ dgamma(0.001, 0.001);
  tau_beta ~ dgamma(0.001, 0.001);

  sigma_c <- 1.0 / sqrt(tau_c);
  sigma_alpha <- 1.0 / sqrt(tau_alpha);
  sigma_beta <- 1.0 / sqrt(tau_beta);

  for (n in 1:N){
      alpha[n] ~ dnorm(alpha_c, tau_alpha);
      beta[n] ~ dnorm(beta_c, tau_beta);
    for (t in 1:T) {
      y[n,t] ~ dnorm(alpha[n] + beta[n] * (x[t] - xbar), tau_c);
    }
  }
}
转化主要集中在模型块,注意二者概率分布的名称以及参数含义对应关系,JAGS 可以省略类型声明,最后,JAGS 不支持 Stan 中的向量化操作,这种新特性是独特的。
library(rjags)
# 初始值
rats_inits <- list(
  list(".RNG.name" = "base::Marsaglia-Multicarry",
       ".RNG.seed" = 20222022,
       "alpha_c" = 100, "beta_c" = 6, "tau_c" = 5, "tau_alpha" = 10, "tau_beta" = 0.5),
  list(".RNG.name" = "base::Marsaglia-Multicarry",
       ".RNG.seed" = 20232023,
       "alpha_c" = 200, "beta_c" = 10, "tau_c" = 15, "tau_alpha" = 15, "tau_beta" = 1)
)
# 模型
rats_model <- jags.model(
  file = "code/rats.bugs",
  data = list(x = x, y = y, N = 30, T = 5, xbar = 22.0),
  inits = rats_inits,
  n.chains = 2, quiet = TRUE
)
# burn-in
update(rats_model, n.iter = 2000)
# 抽样
rats_samples <- coda.samples(rats_model,
  variable.names = c("alpha_c", "beta_c", "sigma_alpha", "sigma_beta", "sigma_c"),
  n.iter = 4000, thin = 1
)
# 参数的后验估计
summary(rats_samples)
#>
#> Iterations = 2001:6000
#> Thinning interval = 1
#> Number of chains = 2
#> Sample size per chain = 4000
#>
#> 1. Empirical mean and standard deviation for each variable,
#> plus standard error of the mean:
#>
#> Mean SD Naive SE Time-series SE
#> alpha_c 242.4752 2.72749 0.030494 0.031571
#> beta_c 6.1878 0.10798 0.001207 0.001481
#> sigma_alpha 14.6233 2.05688 0.022997 0.025070
#> sigma_beta 0.5176 0.09266 0.001036 0.001741
#> sigma_c 6.0731 0.46425 0.005191 0.007984
#>
#> 2. Quantiles for each variable:
#>
#> 2.5% 25% 50% 75% 97.5%
#> alpha_c 237.0333 240.6832 242.5024 244.2965 247.7816
#> beta_c 5.9785 6.1150 6.1867 6.2593 6.4035
#> sigma_alpha 11.1840 13.1802 14.4152 15.8340 19.2429
#> sigma_beta 0.3571 0.4538 0.5098 0.5734 0.7187
#> sigma_c 5.2384 5.7479 6.0455 6.3803 7.0413输出结果与 rstan 十分一致,且采样速度极快。
35.5.7 MCMCglmm
同前,先考虑变截距的混合效应模型,MCMCglmm 包 (Hadfield 2010) 给出的拟合结果与 nlme 包很接近。
 Iterations = 3001:12991
 Thinning interval  = 10
 Sample size  = 1000

 DIC: 1088.591

 G-structure:  ~rats

     post.mean l-95% CI u-95% CI eff.samp
rats     211.4    113.9    344.4     1000

 R-structure:  ~units

      post.mean l-95% CI u-95% CI eff.samp
units     68.77    52.01    85.12     1000

 Location effects: weight ~ days

            post.mean l-95% CI u-95% CI eff.samp  pMCMC
(Intercept)   106.537  100.354  112.430     1000 <0.001 ***
days            6.187    6.048    6.321     1000 <0.001 ***
---
Signif. codes:  0 ‘***’ 0.001 ‘**’ 0.01 ‘*’ 0.05 ‘.’ 0.1 ‘ ’ 1
随机效应的方差(组间方差)为 211.4 ,则标准差为 14.539。残差方差(组内方差)为 68.77,则标准差为 8.293。
再考虑变截距和斜率的混合效应模型。
 Iterations = 3001:12991
 Thinning interval  = 10
 Sample size  = 1000

 DIC: 1019.238

 G-structure:  ~us(1 + days):rats

                             post.mean l-95% CI u-95% CI eff.samp
(Intercept):(Intercept).rats  123.2867  45.2664 231.0724    855.7
days:(Intercept).rats          -0.7634  -4.4912   1.9633    801.4
(Intercept):days.rats          -0.7634  -4.4912   1.9633    801.4
days:days.rats                  0.2746   0.1059   0.4926    868.6

 R-structure:  ~units

      post.mean l-95% CI u-95% CI eff.samp
units     38.16    26.67    49.33    898.4

 Location effects: weight ~ days

            post.mean l-95% CI u-95% CI eff.samp  pMCMC
(Intercept)   106.517  101.687  110.698     1000 <0.001 ***
days            6.181    5.987    6.403     1000 <0.001 ***
---
Signif. codes:  0 ‘***’ 0.001 ‘**’ 0.01 ‘*’ 0.05 ‘.’ 0.1 ‘ ’ 1
G-structure 代表随机效应部分,R-structure 代表残差效应部分,Location effects 代表固定效应部分。MCMCglmm 包的这套模型表示术语源自商业软件 ASReml 。
随机截距的方差为 123.2867,标准差为 11.1034,随机斜率的方差 0.2746,标准差为 0.524,随机截距和随机斜率的协方差 -0.7634,相关系数为 -0.131,这与 nlme 包结果很接近。
35.5.8 INLA
同前,先考虑变截距的混合效应模型,结果和 nlme 包基本一样。
Time used:
    Pre = 1.88, Running = 4.21, Post = 0.0267, Total = 6.12
Fixed effects:
               mean    sd 0.025quant 0.5quant 0.975quant    mode kld
(Intercept) 106.568 3.019    100.628  106.568    112.509 106.568   0
days          6.186 0.067      6.053    6.186      6.318   6.186   0

Random effects:
  Name    Model
    rats IID model

Model hyperparameters:
                                         mean    sd 0.025quant 0.5quant 0.975quant  mode
Precision for the Gaussian observations 0.015 0.002      0.011    0.015      0.019 0.015
Precision for rats                      0.005 0.001      0.004    0.005      0.007 0.005

Marginal log-Likelihood:  -604.26
再考虑变截距和斜率的混合效应模型。
# https://inla.r-inla-download.org/r-inla.org/doc/latent/iid.pdf
# 二维高斯随机效应的先验为 Wishart prior
rats_data$slopeid <- 30 + rats_data$rats
# 变截距、变斜率
rats_inla2 <- inla(
  weight ~ 1 + days + f(rats, model = "iid2d", n = 2 * 30) + f(slopeid, days, copy = "rats"),
  data = rats_data, family = "gaussian"
)
# 输出结果
summary(rats_inla2)
Time used:
Pre = 1.59, Running = 0.613, Post = 0.0274, Total = 2.23
Fixed effects:
mean sd 0.025quant 0.5quant 0.975quant mode kld
(Intercept) 106.568 1.537 103.552 106.568 109.584 106.568 0
days 6.186 0.121 5.948 6.186 6.423 6.186 0
Random effects:
Name Model
rats IID2D model
slopeid Copy
Model hyperparameters:
mean sd 0.025quant 0.5quant 0.975quant mode
Precision for the Gaussian observations 0.017 0.002 0.014 0.017 0.020 0.017
Precision for rats (component 1) 8.534 1.001 6.987 8.409 10.879 7.981
Precision for rats (component 2) 3.420 0.467 2.722 3.352 4.533 3.137
Rho1:2 for rats 0.054 0.080 -0.132 0.065 0.174 0.118
Marginal log-Likelihood: -588.65 对于变截距和斜率混合效应模型,还未完全弄清楚 INLA 包的输出结果。固定效应部分和残差部分都是和前面一致的,但不清楚随机效应的方差协方差矩阵的估计与 INLA 输出的对应关系。参考《Bayesian inference with INLA》第 3 章第 3 小节。
35.6 总结
基于 rats 数据建立变截距、变斜率的分层正态模型,也是线性混合效应模型的一种特殊情况,下表给出不同方法对模型各个参数的估计及置信区间。
表中给出截距 \(\beta_0\) 、斜率 \(\beta_1\) 、随机截距 \(\sigma_0\)、随机斜率 \(\sigma_1\)、残差 \(\sigma_{\epsilon}\) 等参数的估计及 95% 的置信区间,四舍五入保留 3 位小数。
35.7 习题
-
四个组的重复测量数据,如下表所示,建立贝叶斯线性混合效应模型/分层正态模型分析数据,与 nlme 包拟合的结果对比。
表格 35.2: 实验数据 编号 第1组 第2组 第3组 第4组 1 62 63 68 56 2 60 67 66 62 3 63 71 71 60 4 59 64 67 61 5 65 68 63 6 66 68 64 7 63 8 59 \[ \begin{aligned} y_{ij} \sim \mathcal{N}(\theta_i, \sigma^2) &\quad \theta_i \sim \mathcal{N}(\mu, \tau^2) \\ (\mu,\log \sigma, \tau) &\sim \mathrm{uniform\ prior} \\ i = 1,2,3,4 &\quad j = 1,2, \ldots, n_i \end{aligned} \]
\(y_{ij}\) 表示第 \(i\) 组的第 \(j\) 个测量值,\(\theta_i\) 表示第 \(i\) 组的均值,\(\mu\) 表示整体的均值,\(\sigma^2\) 表示组内的方差,\(\tau^2\) 表示组内的方差。
#> Linear mixed-effects model fit by REML #> Data: dat #> AIC BIC logLik #> 121.7804 125.1869 -57.89019 #> #> Random effects: #> Formula: ~1 | group #> (Intercept) Residual #> StdDev: 3.419288 2.366309 #> #> Fixed effects: y ~ 1 #> Value Std.Error DF t-value p-value #> (Intercept) 64.01266 1.780313 20 35.95584 0 #> #> Standardized Within-Group Residuals: #> Min Q1 Med Q3 Max #> -2.18490896 -0.59921167 0.09332131 0.54077636 2.17507789 #> #> Number of Observations: 24 #> Number of Groups: 4随机效应(组间标准差)\(\tau^2\) 3.419288 、残差效应(组内标准差)\(\sigma^2\) 2.366309。截距 \(\mu\) 64.01266 代表整体的均值。各组的均值如下:
也可以调用 rjags 包连接 JAGS 软件做贝叶斯推理,JAGS 代码如下:
model {
  ## specify the distribution for observations
  for(i in 1:n){
    y[i] ~ dnorm(theta[group[i]], 1/sigma2)
  }

  ## specify the prior for theta
  for(j in 1:J){
    theta[j] ~ dnorm(mu, 1/tau2)
  }

  ## specify the prior for hyperparameters
  mu ~ dunif(55, 75)

  log_sigma ~ dunif(-10, 3)
  sigma2 <- exp(2*log_sigma)
  sigma <- exp(log_sigma)

  tau ~ dunif(0, 8)
  tau2 <- pow(tau, 2)
}
完整的运行代码如下:
library(rjags)
# 参考值
mu_a <- min(y)
mu_b <- max(y)
log_sigma_b <- 2 * log(sd(y))
tau_b <- 2 * sd(y)

J <- 4            # 4 个组
n <- length(y)    # 观察值数量
N <- 1500         # 总采样数
nthin <- 1        # 采样间隔
nchains <- 2      # 2 条链
ndiscard <- N / 2 # 预处理阶段 warm-up / burn-in

# 初始值
jags_inits <- list(
  list(".RNG.name" = "base::Marsaglia-Multicarry",
       ".RNG.seed" = 20222022,
       "theta" = rep(3, 4), "mu" = 60, "log_sigma" = 0, "tau" = 1.5),
  list(".RNG.name" = "base::Marsaglia-Multicarry",
       ".RNG.seed" = 20232023,
       "theta" = rep(2, 4), "mu" = 60, "log_sigma" = 1, "tau" = 0.375)
)
# Call JAGS from R
jags_model <- jags.model(
  file = "code/hnm.bugs",
  data = list("y" = y, "group" = group, "J" = J, "n" = n),
  inits = jags_inits, n.chains = nchains, quiet = TRUE
)
# burn-in
update(jags_model, n.iter = ndiscard)
# 抽样
jags_samples <- coda.samples(jags_model,
  variable.names = c('theta','mu','sigma','tau'), n.iter = N
)
# 参数的后验估计
summary(jags_samples)
#> #> Iterations = 1751:3250 #> Thinning interval = 1 #> Number of chains = 2 #> Sample size per chain = 1500 #> #> 1. Empirical mean and standard deviation for each variable, #> plus standard error of the mean: #> #> Mean SD Naive SE Time-series SE #> mu 64.142 2.3470 0.04285 0.05879 #> sigma 2.473 0.4278 0.00781 0.01117 #> tau 4.372 1.5995 0.02920 0.05101 #> theta[1] 61.356 1.2301 0.02246 0.02503 #> theta[2] 65.877 1.0056 0.01836 0.01928 #> theta[3] 67.696 1.0247 0.01871 0.02119 #> theta[4] 61.186 0.8694 0.01587 0.01692 #> #> 2. Quantiles for each variable: #> #> 2.5% 25% 50% 75% 97.5% #> mu 59.145 62.700 64.167 65.510 69.027 #> sigma 1.795 2.165 2.424 2.718 3.471 #> tau 1.846 3.128 4.171 5.464 7.652 #> theta[1] 58.947 60.545 61.342 62.161 63.771 #> theta[2] 63.866 65.228 65.878 66.548 67.872 #> theta[3] 65.665 67.046 67.712 68.337 69.692 #> theta[4] 59.446 60.632 61.189 61.707 62.975 -
基于 lme4 包中学生对老师的评价数据
InstEval建立(广义)线性混合效应模型分析数据。将响应变量(学生评价)视为有序的离散型变量,比较观察两个模型拟合效果(lme4、GLMMadaptive、spaMM 都不支持有序的响应变量,brms 则支持各类有序回归,使用语法与 lme4 完全一样。但是,由于数据规模比较大,计算时间数以天计,可考虑用 Stan 直接编码)。再者,从 Stan 实现的贝叶斯模型来看,感受 Stan 建模的灵活性和扩展性。(nlme 包不支持此等交叉随机效应的表达。)#> 'data.frame': 73421 obs. of 7 variables: #> $ s : Factor w/ 2972 levels "1","2","3","4",..: 1 1 1 1 2 2 3 3 3 3 ... #> $ d : Factor w/ 1128 levels "1","6","7","8",..: 525 560 832 1068 62 406 3 6 19 75 ... #> $ studage: Ord.factor w/ 4 levels "2"<"4"<"6"<"8": 1 1 1 1 1 1 1 1 1 1 ... #> $ lectage: Ord.factor w/ 6 levels "1"<"2"<"3"<"4"<..: 2 1 2 2 1 1 1 1 1 1 ... #> $ service: Factor w/ 2 levels "0","1": 1 2 1 2 1 1 2 1 1 1 ... #> $ dept : Factor w/ 14 levels "15","5","10",..: 14 5 14 12 2 2 13 3 3 3 ... #> $ y : int 5 2 5 3 2 4 4 5 5 4 ...- 因子型变量
s表示 1-2972 位参与评分的学生。 - 因子型变量
d表示 1-2160 位上课的讲师。 - 因子型变量
dept表示课程相关的 1-15 院系。 - 因子型变量
service表示讲师除了授课外,是否承担其它服务。 - 数值型变量
y表示学生给课程的评分,1-5 分对应从坏到很好。
# 数值型的响应变量
fit_lme4 <- lme4::lmer(y ~ 1 + service + (1 | s) + (1 | d) + (1 | dept), data = InstEval)
summary(fit_lme4)
#> Linear mixed model fit by REML ['lmerMod'] #> Formula: y ~ 1 + service + (1 | s) + (1 | d) + (1 | dept) #> Data: InstEval #> #> REML criterion at convergence: 237733.8 #> #> Scaled residuals: #> Min 1Q Median 3Q Max #> -3.0597 -0.7478 0.0404 0.7723 3.1988 #> #> Random effects: #> Groups Name Variance Std.Dev. #> s (Intercept) 0.105998 0.32557 #> d (Intercept) 0.265221 0.51500 #> dept (Intercept) 0.006912 0.08314 #> Residual 1.386500 1.17750 #> Number of obs: 73421, groups: s, 2972; d, 1128; dept, 14 #> #> Fixed effects: #> Estimate Std. Error t value #> (Intercept) 3.28259 0.02935 111.858 #> service1 -0.09264 0.01339 -6.919 #> #> Correlation of Fixed Effects: #> (Intr) #> service1 -0.152lme4 包不支持响应变量为有序分类变量的情形,可用 ordinal 包,此等规模数据,拟合模型需要 5-10 分钟时间。
# 有序因子型的响应变量 InstEval$y <- factor(InstEval$y, ordered = TRUE) library(ordinal) fit_ordinal <- clmm( y ~ 1 + service + (1 | s) + (1 | d) + (1 | dept), data = InstEval, link = "probit", threshold = "equidistant" ) summary(fit_ordinal) ## MCMCglmm library(MCMCglmm) prior2 <- list( R = list(V = 1, nu = 0.002), G = list( G1 = list(V = 1, nu = 0.002), G2 = list(V = 1, nu = 0.002), G3 = list(V = 1, nu = 0.002) ) ) # 响应变量视为数值变量 fit_mcmc2 <- MCMCglmm( y ~ service, random = ~ s + d + dept, family = "gaussian", data = InstEval, verbose = FALSE, prior = prior2 ) # 响应变量视为有序的分类变量 fit_mcmc3 <- MCMCglmm( y ~ service, random = ~ s + d + dept, family = "ordinal", data = InstEval, verbose = FALSE, prior = prior2 )当数据量较大时,MCMCglmm 包拟合模型需要很长时间,放弃,此时,Stan 的相对优势可以体现出来了。Stan 适合大型复杂概率统计模型。
- 因子型变量
